Introduction: Manganese played a significant role in
the lamination problems that plagued WWII Jefferson nickels because of how it
behaves during melting, oxidation, and mechanical working of the wartime alloy.
When the U.S. Mint substituted silver and manganese for nickel in 1942, they
created a ternary (i.e., three) metal alloy system-Cu-Ag-Mn
(Copper/Silver/Manganese)-that was never fully compatible metallurgically.
Manganese has a strong affinity for oxygen, far stronger than copper or silver,
so even under controlled furnace conditions it readily forms oxides during
melting. These oxides do not dissolve back into the metal; instead, they remain
as hard, brittle particles suspended in the alloy. From the moment the strip is
cast, the metal already contains microscopic inclusions that resist bonding
with the surrounding silver (Ag)/copper (Cu) matrix.
As the strip is rolled to final gauge, those manganese-rich
inclusions become stretched into long, thin stringers (i.e., a stretched area
of impurities). Because the oxides and sulfides do not deform plastically, the
surrounding copper-silver matrix flows around them, elongating them into
continuous seams. These seams are mechanically weak: they interrupt grain
boundaries (i.e., metal junctions), create discontinuities in the metal's
internal framework, and act as pre-existing fracture planes (i.e., crack paths).
Even before a blank is punched or a coin is struck, the alloy contains built-in
layers that are poorly bonded and are prone to separation.
During striking, the high-pressure metal flow further
concentrates these manganese-oxide stringers near the surface, where the metal
is under the greatest strain. This is why war nickels often show fine, parallel
streaking-evidence of the elongated inclusions aligned with die flow. The
surface enrichment of manganese, combined with the brittle nature of its
oxides, creates a thin zone where the metal is especially vulnerable. Any post-mint
stress-circulation wear, pocket impacts, or even mild thermal cycling in coin
circulation-can exploit these weak seams, causing the surface metal to lift,
peel, or flake.
Over time, the result is a lamination behavior where the
problem is not simply that manganese is present, but that its chemical
tendencies and mechanical incompatibility of Mn with the Cu-Ag matrix creating
inclusions the U.S. Mint could not eliminate. The wartime alloy was a
compromise born of necessity, and its internal flaws were locked in from the
moment the strip solidified.
SEM/EDS and XRF complement each other almost perfectly when
you're trying to understand manganese-oxide stringers (see the Definition
section) or other elongated Mn-rich anomalies on wartime alloys. SEM gives you
high-resolution imaging showing the actual morphology of these features-whether
they appear as thin seams, nodules, or discontinuous oxide trains running along
worked grain flow. Backscattered electron (BSE) contrast makes Mn-oxide phases
stand out clearly because they have a different average atomic number than the
surrounding Cu-Ag matrix. Once you locate them visually, point EDS or line
scans can confirm their chemistry, showing Mn with associated oxygen, sometimes
accompanied by minor environmental contaminants such as S (sulfur) and/or Cl
(chlorine) depending on the specific oxide/sulfide/chloride mixture.
XRF then gives you the bulk context that SEM/EDS cannot.
Because XRF penetrates a much deeper and wider volume than SEM/EDS, it captures
the overall Mn content and flags whether the alloy contains enough manganese
for these oxide seams to be metallurgically expected. Even though XRF cannot
spatially resolve the stringers, it confirms that the anomalies you see under
SEM are not contaminants or isolated defects-they're the surface expression of
a broader Mn-bearing system within the coin's alloy. When you combine the two
methods, SEM/EDS tells you where and what the anomalies are,
while XRF tells you how much manganese is present in the bulk and
whether the observed features fit the expected alloy chemistry. Together, they
give you a complete, non-destructive picture of Mn-oxide behavior in these
coins. We explore these XRF and SEM/EDS assay differences in this paper.
Analytical Methodology
SEM (Scanning
Electron Microscope) equipped with EDS (Energy Dispersive X-ray Spectrometer)
can capture detailed images and identify elements simultaneously on the surface
of coins. For imaging, SEM is widely used since it needs minimal sample
preparation and produces excellent resolution, unique contrast, and a large
depth of field. When paired with an EDS system, elemental information of the
imaged area can also be derived. SEM/EDS is ideal for imaging and elemental
analysis applications requiring higher resolution than optical microscopy and
identifying elemental make up (1).
In SEM, an
image is formed by scanning a focused electron beam, usually with energies of 1
to 20 keV, across a sample and detecting the ejected secondary or backscattered
electrons. The incident electron beam, when imparting energy to the
sample, can cause emission of x-rays that are characteristic of the sample
atoms. The energies of the x-rays are characterized (3).
The typical
spatial resolution of SEM imaging is about 5-10 nanometers. SEM-based EDS
is primarily a qualitative technique providing data for an area only about a
micrometer in diameter and a micrometer deep (1).
The strengths
of SEM/EDS lie in its ability to provide rapid, high-resolution imaging, and
enabling quick identification of elements present. Its excellent depth of field
and versatility as a platform supporting various tools make it an asset.
XRF has some
advantages over SEM/EDS analysis. X-ray fluorescence (XRF) offers truly
non-destructive, in-situ analysis of a coin's elemental composition without the
need for high vacuum conditions or extensive sample preparation. Unlike
SEM/EDS, which requires placing the specimen inside a vacuum chamber, handheld
or benchtop XRF instruments can rapidly probe coins in their
entirety-preserving patina, surface treatments, and historical residues. This
makes XRF particularly well-suited for museum or field studies where
maintaining the artifact's integrity is paramount. Additionally, XRF's larger
analytical footprint averages over a broader area, reducing the risk of
misinterpreting localized inclusions or surface contaminants as representative
of the whole alloy.
Beyond
logistical conveniences, XRF typically achieves superior sensitivity for many
trace and heavier elements (e.g., Sn, Pb, Ag) that are critical for
distinguishing minting practices.
The deeper
penetration depth of keV-scale X-rays means XRF samples slightly below the
surface, offering a more bulk-reflective composition than the sub-micron
interaction volume of SEM/EDS, which mostly captures only the very topmost
layers. This bulk perspective improves statistical reliability when comparing
coins across collections or establishing provenance based on minor alloying
additions-core to numismatic metallurgy research. The main disadvantage of XRF is
that many XRF devices if not analyzing in a vacuum chamber cannot pick up the
lighter elements like sulfur and chlorine (i.e., two of the most common
environmental contaminant metals found on almost all coin surfaces in
particular for coins a century old or older) whereas SEM/EDS which must operate
in a vacuum chamber can detect these lighter elements.
Table 1. Pre-Screening XRF
Analysis of Coins #1-#3 (Surface Triplicate Analyses: Replicates (Rep) #1-#3) *:
Copper (Cu), Manganese (Mn), Zinc (Zn) & Silver (Ag).
|
Coin
|
Rep*
|
Cu (%)
|
Fe (%)
|
Ni (%)
|
Mn (%)
|
Zn (%)
|
Sn (%)
|
Ag (%)
|
Pb (%)
|
Se (%)
|
|
1
|
1
|
54.45
|
ND
|
ND
|
8.21
|
0.12
|
ND
|
37.08
|
ND
|
ND
|
|
2
|
54.22
|
ND
|
ND
|
8.14
|
0.12
|
ND
|
37.37
|
ND
|
ND
|
|
3
|
53.80
|
ND
|
ND
|
8.29
|
0.12
|
ND
|
37.66
|
ND
|
ND
|
|
2
|
1
|
53.76
|
ND
|
ND
|
6.01
|
0.42
|
ND
|
39.48
|
ND
|
ND
|
|
2
|
53.73
|
ND
|
ND
|
5.35
|
0.38
|
ND
|
40.10
|
ND
|
ND
|
|
3
|
52.87
|
ND
|
ND
|
6.56
|
0.39
|
ND
|
40.04
|
ND
|
ND
|
|
3
|
1
|
54.22
|
ND
|
ND
|
8.10
|
0.39
|
ND
|
37.21
|
ND
|
ND
|
|
2
|
54.47
|
ND
|
ND
|
8.21
|
0.13
|
ND
|
37.12
|
ND
|
ND
|
|
3
|
54.34
|
ND
|
ND
|
8.84
|
ND
|
ND
|
36.58
|
ND
|
ND
|
*Three total
random target points were selected on both the obverse and reverse. The Red
Book alloy composition is 56% Cu, 35% Ag & 9% Mn. Zinc at 0.12-0.39% is
fully consistent with trace Zn naturally present in copper refinery feedstock
and residual brass equipment contamination.
Overall
Microstructure Assessment
Sulfur &
Chloride Incompatibility in Jefferson War Nickels
Sulfur and
chloride contamination interact with the wartime Cu-Ag-Mn alloy in ways that
amplify the weaknesses manganese already builds into Jefferson war nickels. The
alloy begins this delamination process with manganese-rich oxides throughout
the metal-brittle, non-metallic phases that never fully bond with the
surrounding matrix. These inclusions are the root cause of the series'
chronic lamination issues. When sulfur or chloride is introduced later in
the coin's life through environmental exposure, they don't create new manganese
problems from scratch, but they do exploit and accelerate the instability of
those Mn-bearing phases, especially near the surface where manganese
enrichment is present with these environmental contaminants of chlorine and
sulfur.
Sulfur is the
more reactive of the two, and it readily attacks both copper and silver. But in
the war-nickel alloy, sulfur also interacts with the manganese-rich inclusions.
MnS (Manganese
sulfide) is already a common inclusion in the alloy, and additional sulfur
exposure can darken, embrittle, or expand these sulfide sites. Because MnS is
mechanically weak, any growth or alteration of these inclusions increases the
likelihood that the surrounding metal will separate along those planes. In
practice, sulfur contamination doesn't cause laminations, but it can
worsen the visibility and severity of existing manganese-driven separation
zones, especially in areas where stringers (i.e., elongated or weak seams) that
reach the surface.
Chlorides behave
differently. They don't bond strongly with manganese the way sulfur does, but
they aggressively attack copper, and to a lesser extent silver. In a war
nickel, chloride-driven corrosion tends to initiate at microcracks, seams, and
inclusion boundaries-exactly the places where manganese-oxide stringers already
weaken the structure. Once chlorides penetrate these seams, they can widen them
through underfilm corrosion (i.e., underlayer corrosion), making lamination
edges lift more easily. Chlorides don't chemically destabilize manganese
oxides, but they exploit the mechanical weakness those oxides create, turning
microscopic flaws into visible separations.
Both contaminants
also interact with the surface enrichment of manganese that forms during
rolling and striking. The outermost layer of a war nickel often contains a
higher concentration of Mn-oxide particles than the bulk alloy. This zone is
already brittle, and contaminants that promote corrosion or sulfide formation
can accelerate the breakdown of the thin metal above the stringers. The result
is a coin that becomes more prone to flaking, peeling, or developing darkened,
cratered spots where inclusions intersect the surface. Sulfur and chloride do
not create manganese-related lamination problems on their own, but they
absolutely amplify the vulnerabilities manganese builds into the alloy. Sulfur
can chemically modify Mn-bearing inclusions, while chlorides mechanically
exploit the weak planes those inclusions create. The wartime alloy was already
compromised by manganese's chemistry; environmental contaminants simply push
those flaws further toward visible failure.
Sampling Methodology
The goal was first to perform XRF screening (refer to Table
1 above) without any coin polishing which is normal for this preliminary phase
as not to disrupt the surface and then use SEM/EDS analysis to analyze three
Jefferson War nickels with various degrees of laminated surface deformities
seen in Coins #1, #2 & #3. Each coin to be analyzed will be illustrated and
their surface features identified. The coins for SEM/EDS analysis were also not
polished although this is a standard operating procedure to remove
the so-called "corrosion layer" of the coin's surface to get a true idea of
their alloy. In this case polishing is not being performed with these war
nickels, as the last thing we want to do is mechanically "improve" the upper most
tier of the surface so we can study it. In other words, the top 1-5 microns are
precisely where the alloy's manganese-related effects are occurring, and any
polishing-no matter how performed will remove or smear away the very evidence we
are trying to interpret. This depth of 1-5 microns is the average penetration
depth of SEM/EDS unlike XRF which can usually go to 50 microns on average into
the coin's upper surface (1). So in this study we will see metals which are not
part of the original alloy.
These coins already have a fragile, manganese-enriched skin
created during rolling and striking. That thin layer contains high
concentration of Mn-oxide particles, stringer terminations, and micro-seams.
Once you abrade it, even lightly, you're no longer studying the wartime alloy
we wish to study just a surface preparation area where all the evidence has
been polished away.
The corrosion layer itself is also part of the story.
Manganese oxides and Mn-Cu mixed oxides behave differently from copper oxides,
and their presence in the top few microns is diagnostic. They tend to darken,
form nodules, and create brittle islands that correlate with lamination planes
beneath. If you polish through that layer, you erase the oxidation morphology
that tells you how manganese is interacting with the environment. In a war
nickel, the corrosion layer is not "damage" to be removed-it's a readable
record of how Mn-bearing inclusions have aged, reacted, and sometimes expanded
around this top 1-5-micron layer. It's been recorded that simple surface
polishing can easily remove 1-10 microns of surface metal - obviously an
unwanted procedure in this study (2).
Another reason to avoid polishing is that the alloy's
internal architecture is already compromised. The Mn-oxide and MnS stringers
sit just below the surface and they're extremely thin. Polishing can open them,
smear them, or create false lamination edges that mimic natural defects. Once
that happens, you can't reliably distinguish original metallurgical features
from artifacts of surface preparation. For a series where lamination analysis
depends on subtle visual cues, that's a serious loss of information.
By contrast, analyzing the top 1-5 microns in situ-whether
by microscopy, low-angle lighting, or non-destructive spectroscopy-lets you see
the manganese story intact. You can observe the oxide globules, the streaking
patterns, the micro-cracks at stringer terminations, and the way contaminants
like sulfur or chlorides preferentially attack Mn-rich zones. All of that
disappears the moment you mechanically "polish" the surface.
So again the best practice here was to leave the surface
untouched and treat the top few microns as the primary evidence layer. War
nickels are one of the few U.S. coinage alloys where the surface is more
informative than the bulk and preserving that fragile Mn-enriched skin is
essential if you want to understand how the alloy behaves, corrodes, and
ultimately delaminates. Some corrosion layers can be as thick as 250 um (3) but
of course vary from coin to coin, its age, surface condition, if ever buried
and how it has been exposed to the environment. In this case this coin's
corrosion layer will remain un-polished for reasons given above previously. We
simply deal with these other environmental contaminants in our assay results
such as sodium (Na), potassium (K), zinc (Zn) and calcium (Ca) and explain them
in our assay's (i.e., Map Sum Summaries).
The author is sending these samples to an independent
third-party laboratory at the Michigan State University Research Technology
Support Facility in East Lansing, Michigan. This author has worked with this
Laboratory before on similar three tier SEM/EDS types of analyses. The results
of this section will be for the examination of "select" target coin areas
chosen by this author and MSU. Initially an EDS metal assay by weight
percentages is calculated on what is called a Map Sum Summary. Previous
magnification studies here have been performed at a 400X magnification.
This is followed by a SEM Photomicrograph Microstructure of
the same area as the Map Sum Summary under a chosen specific magnification
level (i.e., normally at 400X) to verify the coin's microstructure as either
twin (grain) line - die struck and not a dendritic cast microstructure.
Finally, a Point & ID SEM Micrograph is performed
showing the different Black and White (B&W) type shaded areas of the
selected SEM Photomicrograph (i.e., either called a Micrograph or
Photomicrograph - both terms are acceptable) and what metal or metal areas
these spectrum areas constitute. In other words, the SEM/EDS apparatus in this
case can target different Black & White (B&W) shaded regions of the SEM
micrograph (i.e., microstructure area) and then determine which metals appear
in these areas and these are classified as discrete spectrum areas. This is
done normally at a 1000X level magnification.
Each area is numbered, and the associated metal assay
results are displayed for each spectrum area. This three-part reporting scheme
(Map Sum Summary/Microstructure Photomicrograph/Point & ID Analysis) will
become clearer once the results are presented. The reader at this point may
wish to review the Glossary of the Definition Terms at the end of this paper to
get a better feel for these scientific terms prior to reviewing the SEM/EDS
data section.
Pictorial Overview of the Three Coins in this Study
Specimen #1: Jefferson Nickel. 1943-S 21.13 mm, 4.73
grams. XRF preliminary analysis targeting the area under Jefferson's chin as a possible
high area of Manganese oxide (MnOx) particles forming on the surface and
starting their delamination process with the coin's surface.
Purpose of the SEM/EDS Analysis for Coin #1: SEM/EDS
at the spot beneath Jefferson's chin allows you to directly verify whether the
darkened, brittle surface features identified by XRF are in fact manganese-oxide
or manganese-sulfide enriched zones beginning to detach from the matrix. High-resolution
SEM imaging will reveal the morphology of these features-whether they appear as
lifted scales, micro-cracks, or thin oxide seams consistent with early-stage
delamination. EDS point and line analyses then confirm the local chemistry,
distinguishing true Mn-rich corrosion products from ordinary cuprite or
environmental deposits. Together, these methods provide the microstructural and
compositional evidence needed to document how manganese-driven inclusions are
initiating surface failure on this 1943-S war nickel.
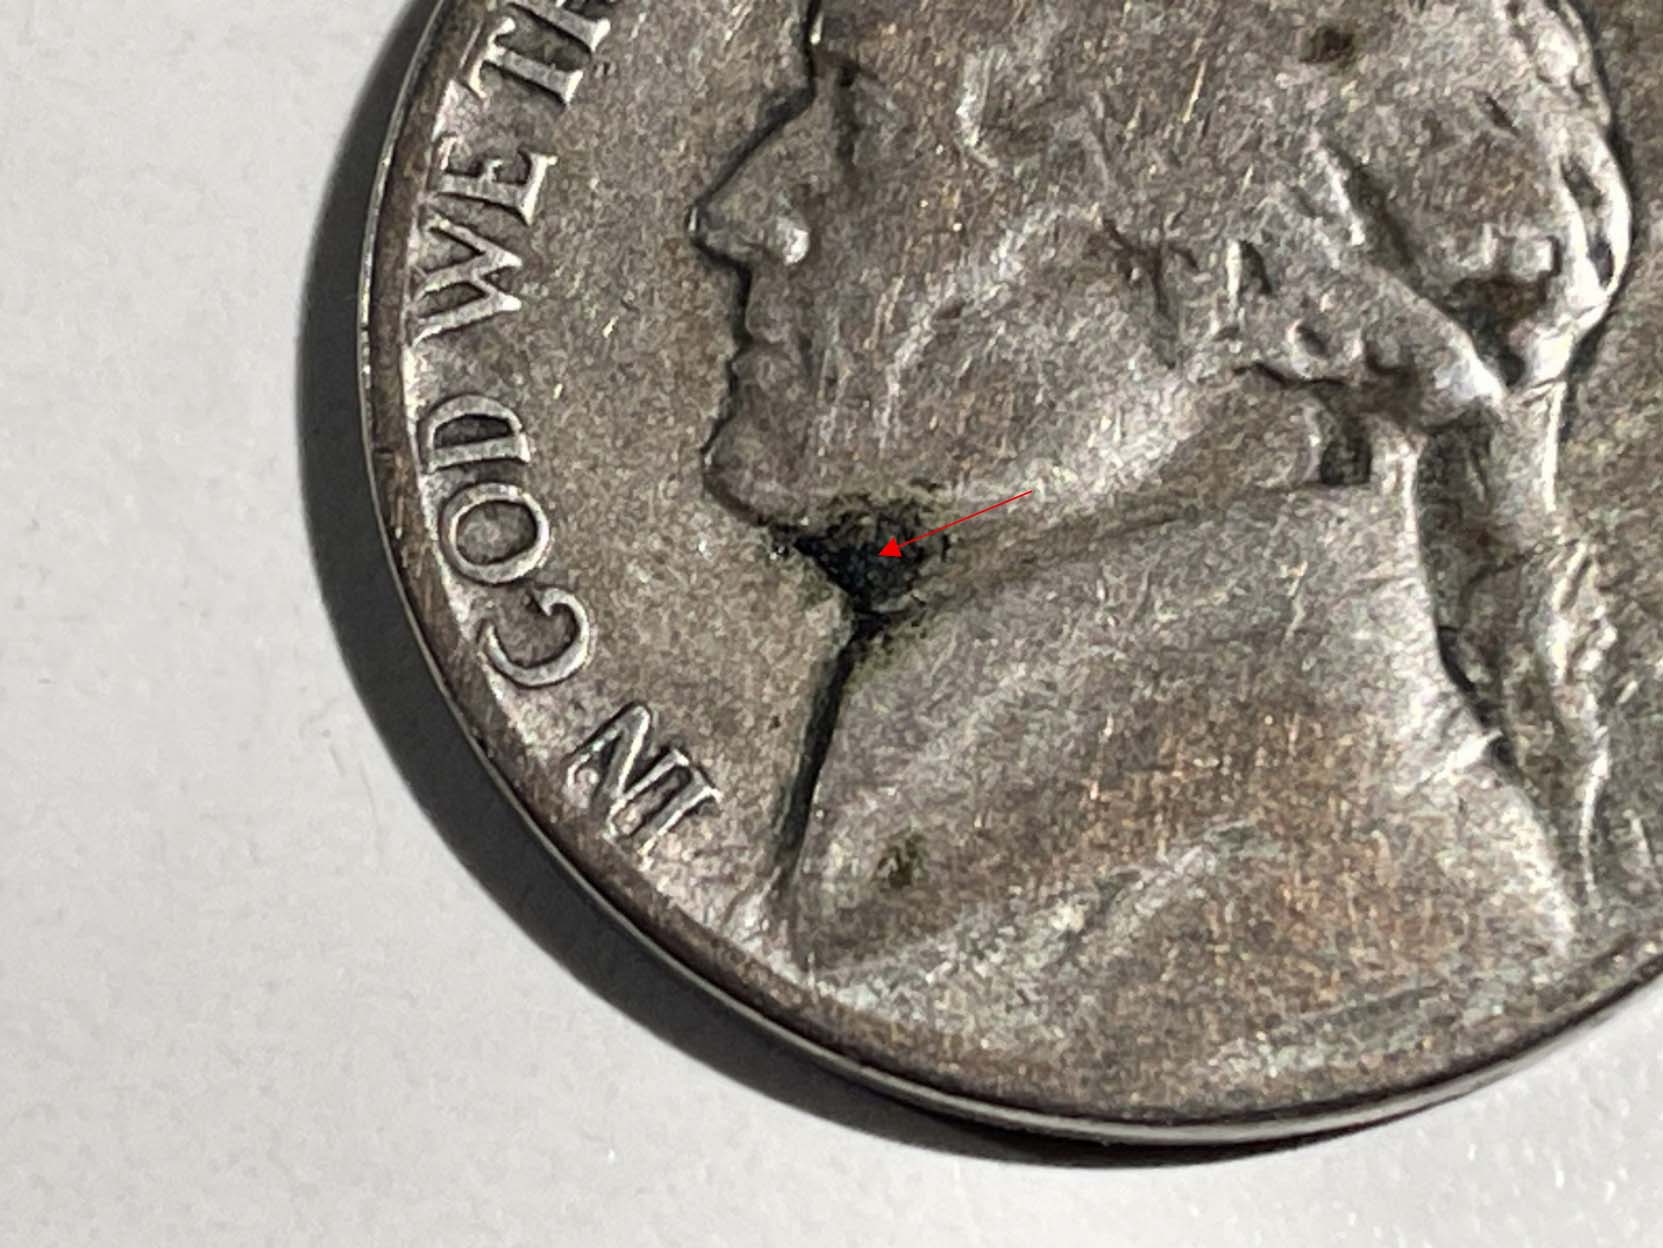
Figure 1: Jefferson Nickel. 1943-S 21.13 mm, 4.73
grams. The manganese-oxide
concentration beneath Jefferson's chin (red arrow pointed area) on this 1943-S war nickel represents a
classic early-stage
surface failure zone in the wartime Cu-Ag-Mn alloy. In this region, Mn-rich oxides have migrated
toward the surface and begun forming brittle, darkened patches that sit within
the surrounding metal. These oxide clusters often mark the initiation point for
micro-lifting and shallow
delamination because the Mn-oxide
phase bonds poorly to the copper-silver
(Cu/Ag) matrix. The spot you're seeing is essentially the visible expression of
that weak interfacial chemistry-an area where the alloy's internal instability
is beginning to break through the surface. Under a stereo microscope at 40-50X the
Mn-oxide appear as individual circular spheres all tightly agglomerated
together as seen by this author in this location under Jefferson's chin area.
Specimen #2: Jefferson Nickel. 1943-P 21.11 mm, 4.73
grams. A severe lamination streak in the lower part of the obverse of
approximately 8.35 mm or ~40% of the obverse surface is observed. As a
lamination of this scale continues to evolve, the weakened Mn-oxide/MnS/MnCl
planes begin to propagate laterally, allowing the separation front to creep
farther across the struck surface. Mechanical stresses from circulation,
temperature cycling, and even minor handling gradually lift the already-compromised
metal, turning a narrow fissure into a broad, sheet-like peel. As the internal
oxide stringers elongate and lose cohesion, the overlying metal loses
structural support and begins to buckle, creating raised, warped, or curling
edges along the 40% affected zone. Eventually, portions of the surface may
detach entirely, possibly exposing darker, Mn-rich substrate material and
leaving an irregular, cratered void where the lamination finally broke free.
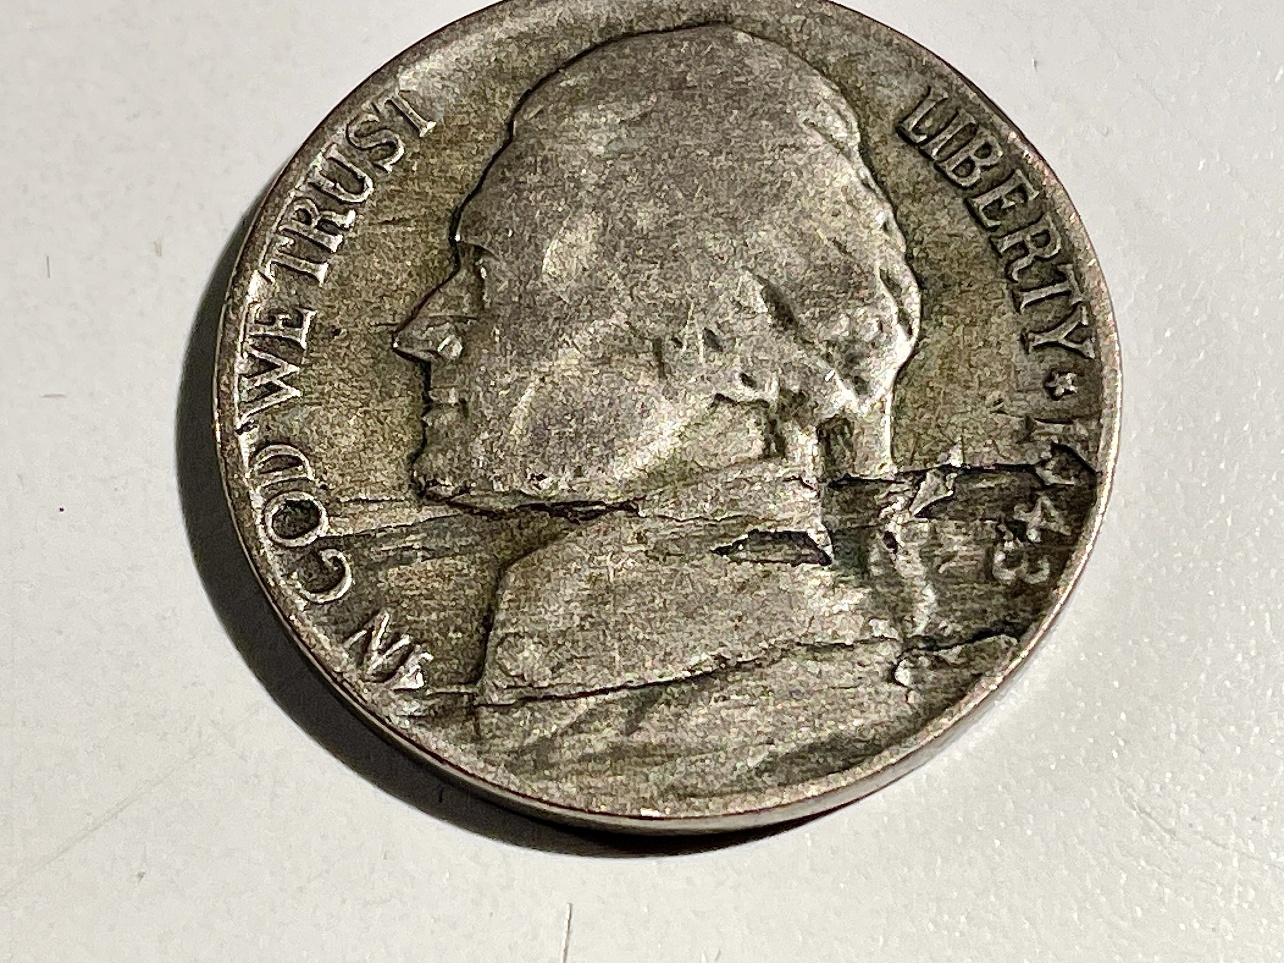
Figure 2: This 1943-P war nickel shows a broad, advanced
lamination zone where a mechanically weak internal plane has migrated outward
and now dominates nearly half of the obverse surface. As the defect expanded,
the underlying Mn-oxide/MnS-rich/Mn-Cl rich layer lost cohesion with the
surrounding Cu-Ag matrix, allowing the upper metal sheet to lift, buckle, and
fracture along its weakest lines. Circulation stress then widened the
separation, turning what began as a narrow internal flaw into a sprawling, sheet-like
peel with irregular edges and stepped elevation changes. Over time, portions of
the lifted metal thin out, curl, or detach entirely, exposing darker substrate
material and leaving a rough, unstable surface. This stage represents the late
evolution of a lamination-where the defect is no longer subtle but has become a
dominant structural failure across the coin's lower obverse.
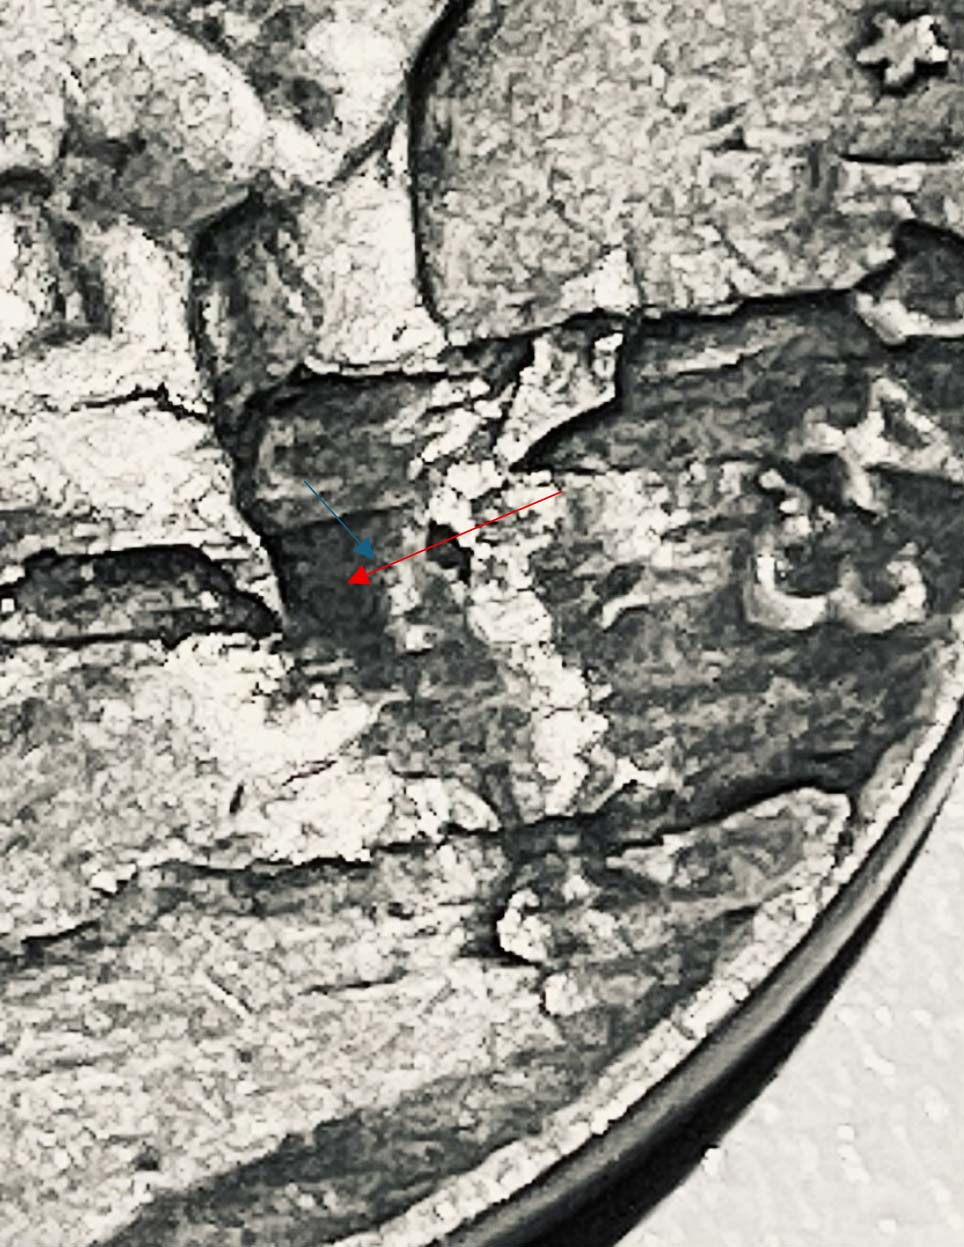
Figure 2A. The dark area patch (refer to the area
pointed by the red arrow) directly to the left of "3" in the date 1943 within
the advanced lamination zone represents a possible localized concentration of
manganese-oxide phases that migrated toward the surface as the internal failure
plane expanded. In wartime Cu-Ag-Mn alloys, these clusters typically consist of
mixed-valence MnOx species-most commonly MnO, Mn3O4, and Mn2O3-reflecting the
alloy's highly oxidizing melt conditions and manganese's strong affinity for
oxygen. MnO often forms the core of these inclusions, while Mn3O4 and Mn2O3
develop as secondary, more brittle surface films that darken with age and
circulation exposure. The presence of these heterogeneous Mn-oxide phases
weakens the surrounding matrix, promoting micro-lifting, fracture propagation,
and the stepped, unstable surface now visible in the lamination field. Their
concentration in this region marks a chemically active failure zone rather than
a purely mechanical rolling-mill lamination. This area was chosen as the
primary target shot for Specimen #2 for the three-part SEM/EDS Triple Tier
analysis (Map Sum Summary - Assay, Microstructure and Point & ID Analysis).
Specimen #3 Jefferson Nickel. 1943-P 21.12 mm, 4.68
grams. Severe lamination peel away in the lower part of the obverse where the
tip of peel away end is ~1.8mm above the surface! As a lamination of this scale
continues to evolve, the weakened Mn-oxide/MnS/MnCl planes begin to propagate
laterally, allowing the separation front to creep farther across the struck
surface as in Coin #2. Mechanical stresses from circulation, temperature
cycling, and even minor handling gradually lift the already-compromised metal,
turning a narrow fissure into a broad, sheet-like peel. The internal oxide
stringers elongate and lose cohesion; the overlying metal loses structural
support and begins warped. Eventually, portions of the surface are nearly detached
entirely, exposing darker, Mn-rich substrate material underneath. Visually
inspecting underneath this peel away layer we see dark rich Mn-oxide layers and
some white powdery layer which was confirmed as AgCl (silver chloride). Silver
chloride does not delaminate this coin. AgCl never laminates a WWII nickel
because it's a surface-only corrosion product-a soft, powdery film that forms after
the metal is already exposed. It has no internal presence, no expansion
pressure, and no mechanical strength, so it cannot lift or separate bonded
metal layers. Only Mn-oxide/Mn-sulfide/Mn-chloride stringers inside the
Cu-Ag-Mn alloy create the weak planes and expansion forces that drive true
wartime lamination.
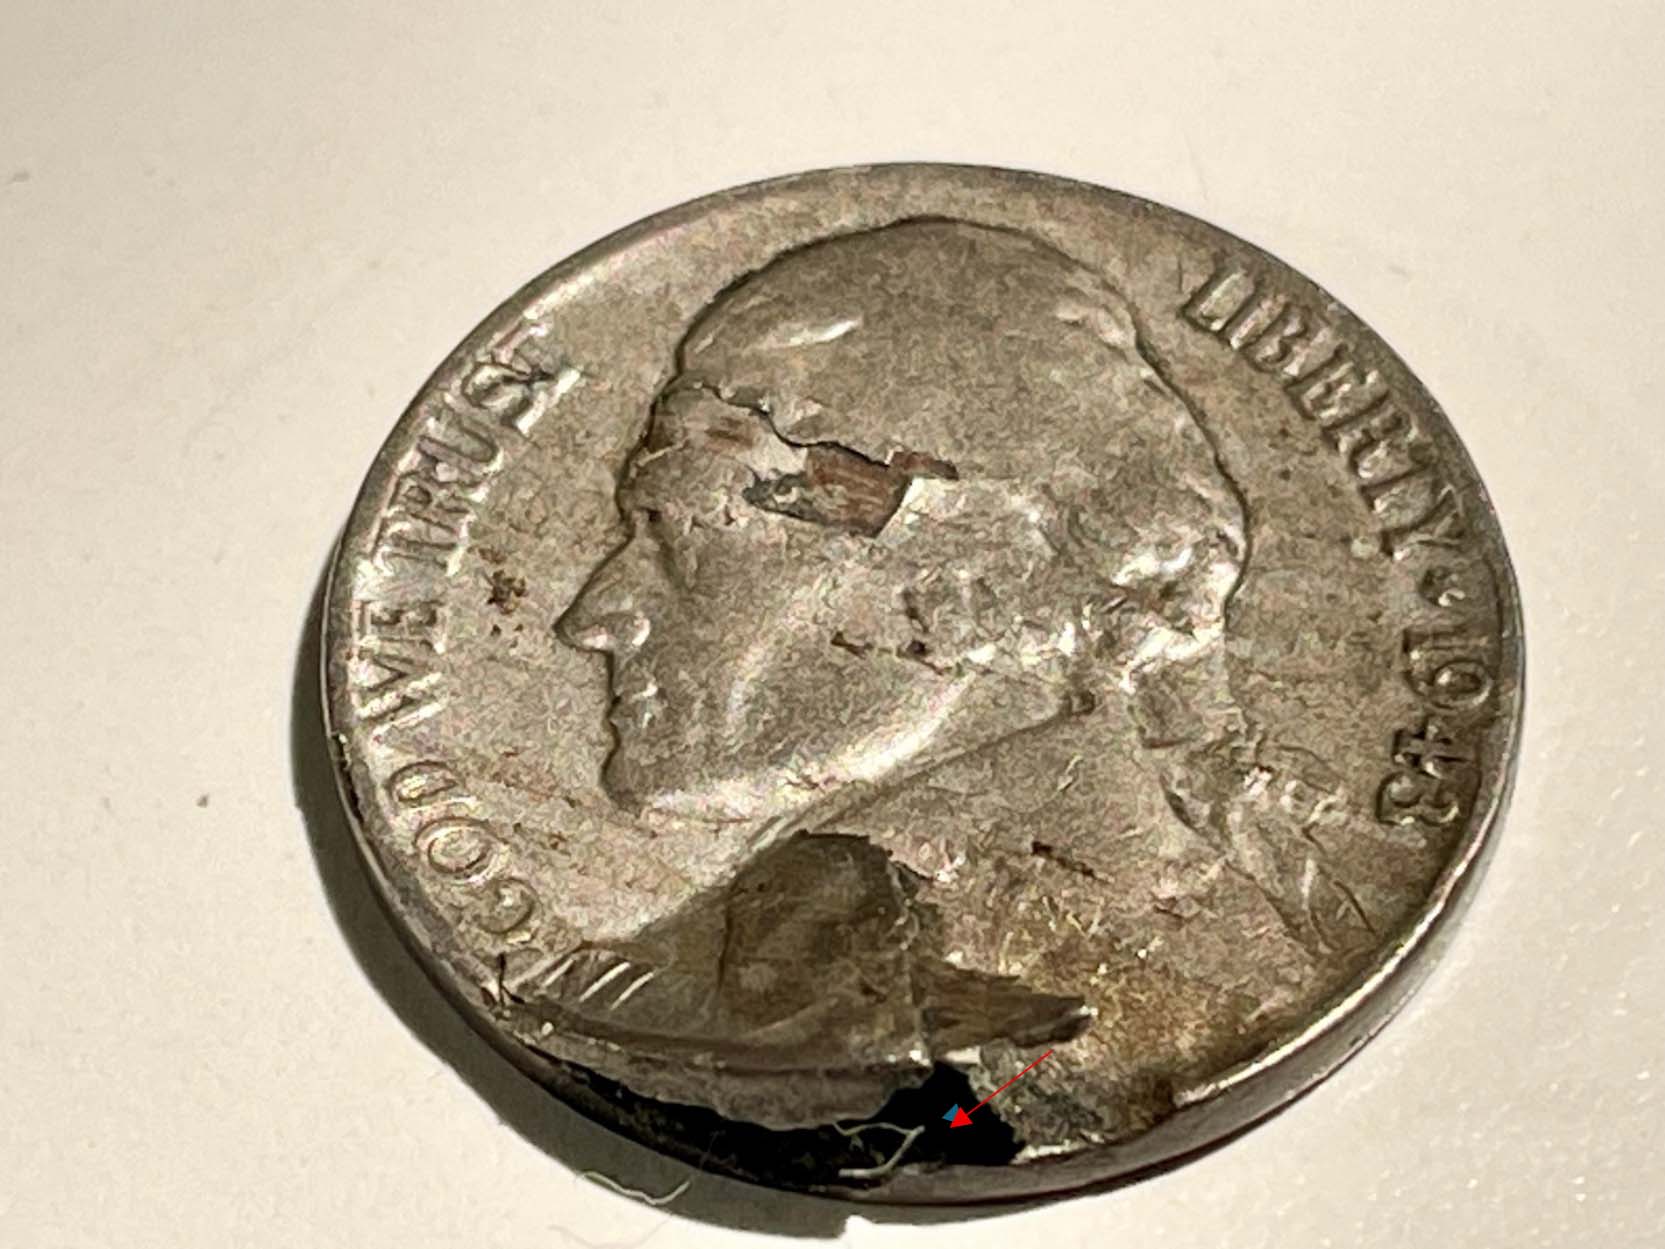
Figure 3: A massive almost peeled away area in the
lower part of the obverse.
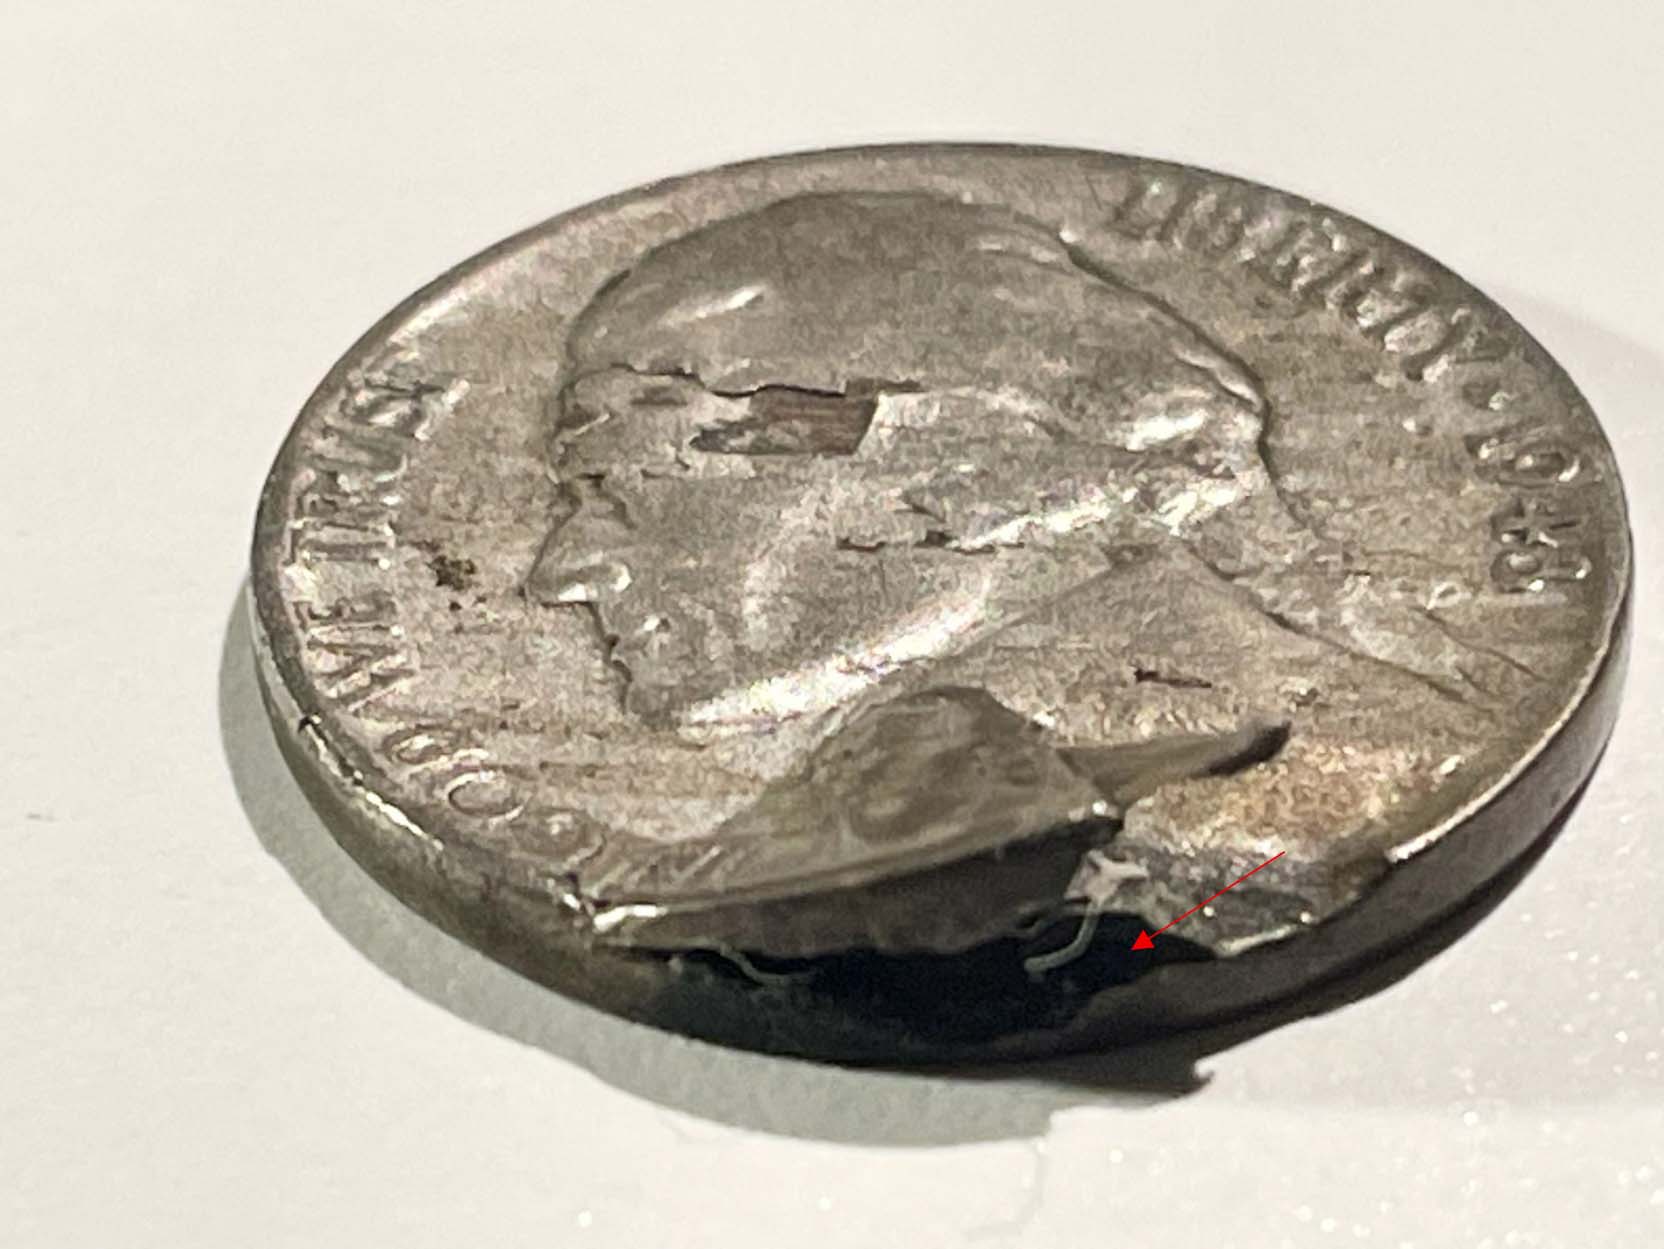
Figure 3-a. Side view angle shot of the peeled away area. The red arrow
marks a dark area seen under the peeled away area and is a possible large
accumulation of Mn-oxide based on preliminary XRF surface analyses. We have
seen as in Coin #1 where Mn-oxide has broken through the surface and in coin #2
has created a massive lamination streak almost entailing half the obverse. In
this case for coin #3 it has generated an incredible peeled away situation. In
coin #3 the target shot for SEM/EDS analysis will be in this red arrow target
zone to further confirm manganese's role in these WWII issues.
In all three coins we will look at these dark areas through The Triple-Tier
Analysis approach: A metal assay (i.e., Map Sum Summary), a microstructure photomicrograph
at a 400X magnification level at the same target point area and then still in
the same associated area the Point & ID summary at a 1000X magnification
level. As explained earlier there can be no polishing done on these sensitive
Mn-oxide areas so as not to remove them. Hence, we may see other environmental contaminants
but, in this case, these unwanted metals cannot be avoided in this study as
polishing the surface to see the so-called true alloy will polish away all the
surface manganese that has migrated to the surface initiating the delamination
process. It's one situation where an SEM/EDS analysis will have to deal with a
top corrosion layer unfortunately remaining intact.
SEM/EDS Analytical Results Coins #1-3:
Coin #1 Map Sum Summary
|
Element
|
Line
Type
|
Apparent
Concentration
|
k
Ratio
|
Wt%
|
Wt%
Sigma
|
Standard
Label
|
Factory
Standard
|
|
C
|
K
series
|
2.11
|
0.02106
|
24.18
|
0.35
|
C
Vit
|
Yes
|
|
O
|
K
series
|
9.88
|
0.03323
|
25.00
|
0.23
|
SiO2
|
Yes
|
|
Cl
|
K
series
|
1.96
|
0.01715
|
4.60
|
0.06
|
NaCl
|
Yes
|
|
Mn
|
K
series
|
6.00
|
0.06001
|
14.09
|
0.14
|
Mn
|
Yes
|
|
Cu
|
K
series
|
12.35
|
0.12350
|
31.57
|
0.26
|
Cu
|
Yes
|
|
Ag
|
L
series
|
0.21
|
0.00211
|
0.56
|
0.08
|
Ag
|
Yes
|
|
Total:
|
|
|
|
100.00
|
|
|
|
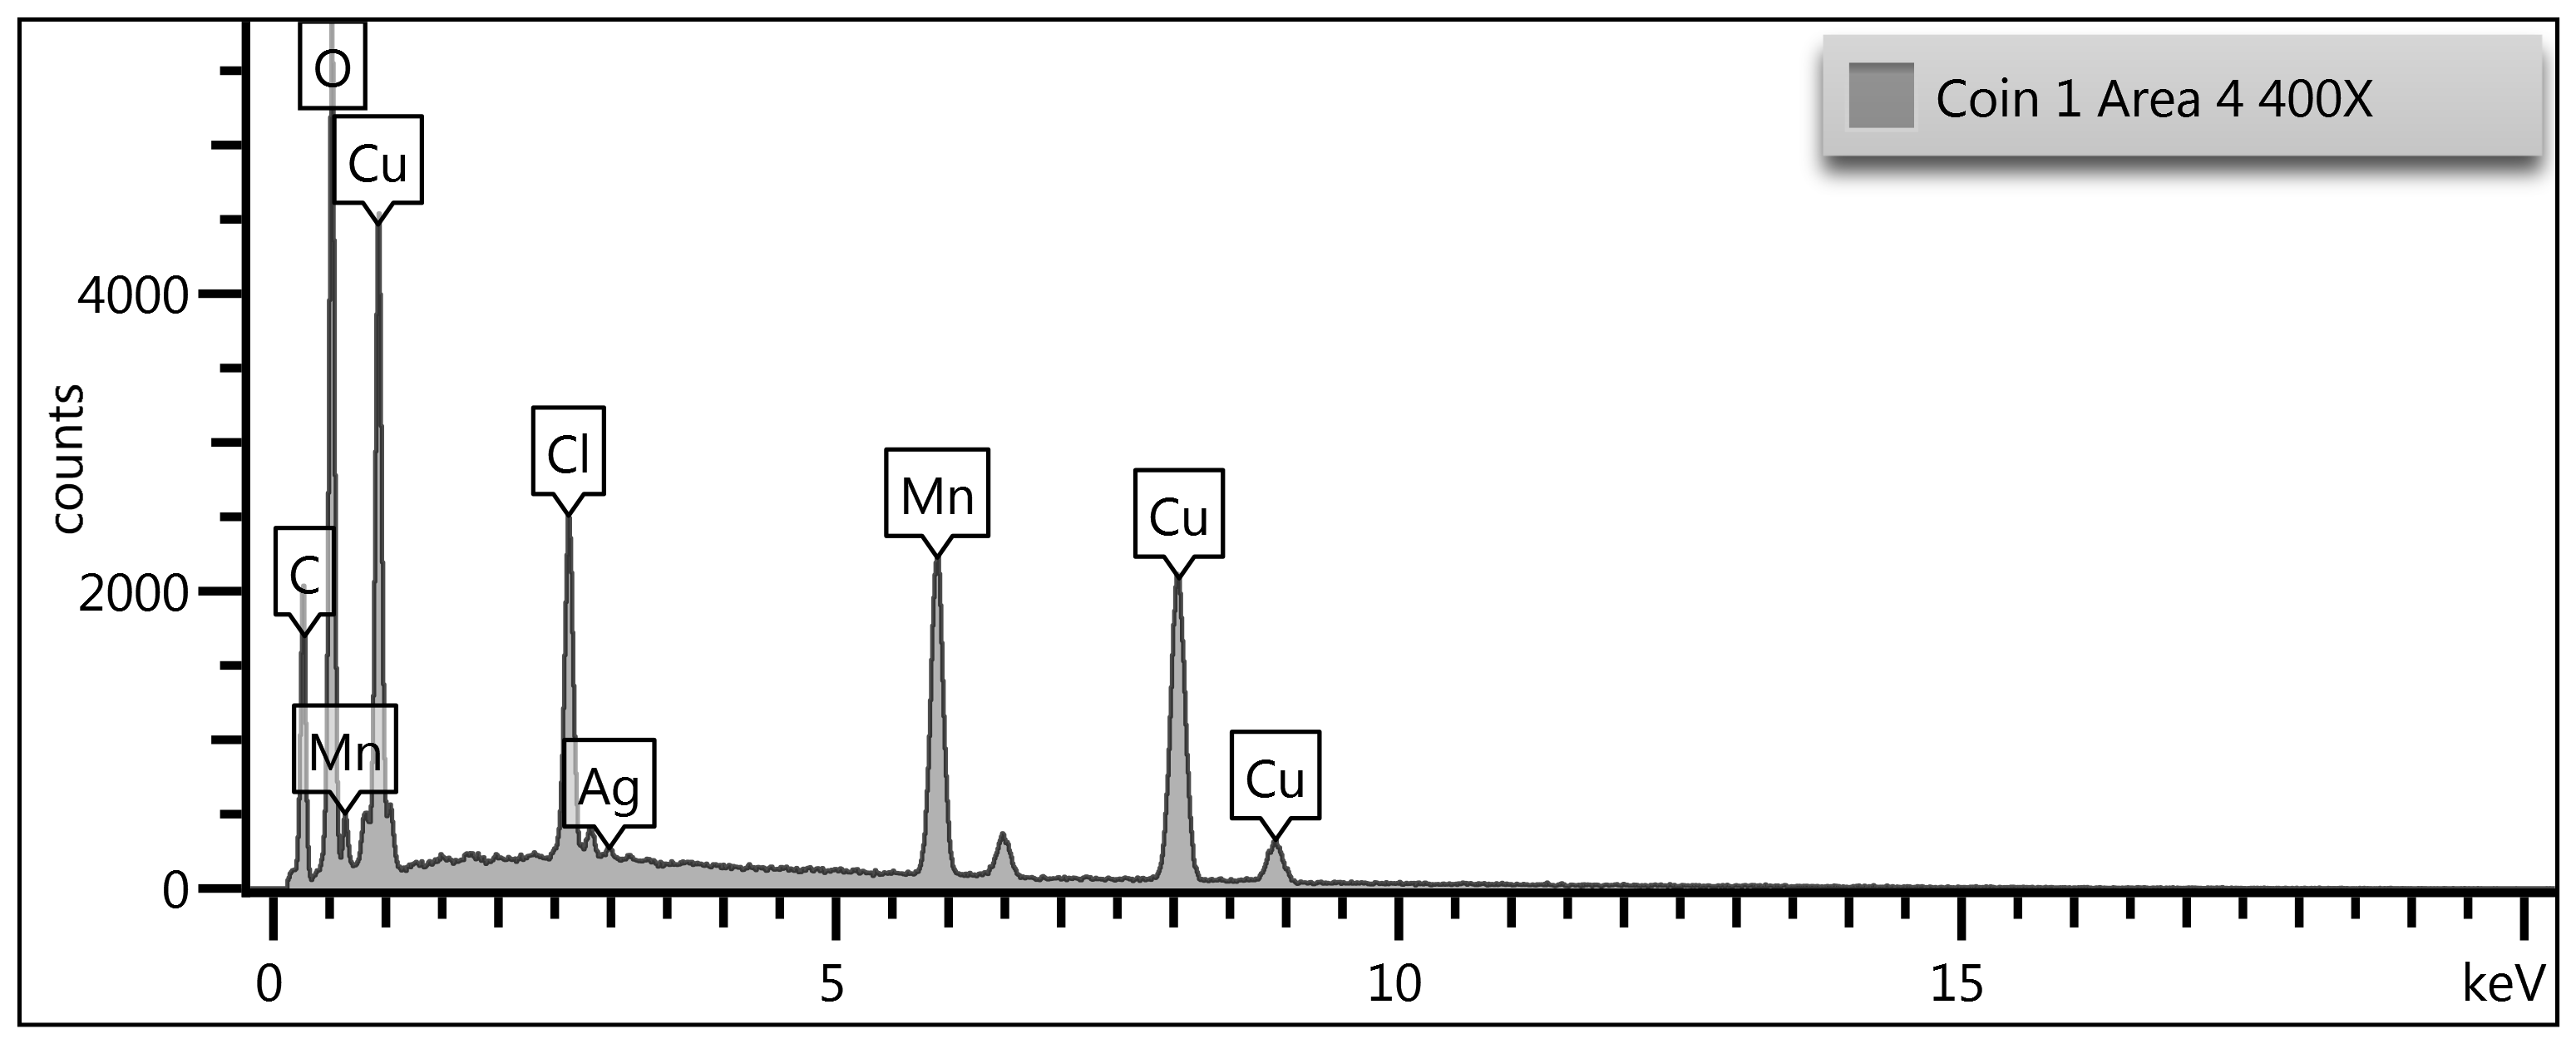
Figure 4-a: Map Sum Summary of Coin #1. Jefferson Nickel.
1943-S. 21.13 mm, 4.73 grams. Extrapolating out the carbon and oxygen and
assuming equal mixing with Mn, Cu & Ag the extrapolated figures are Mn
(27.7%), Cu (62.1%) & Ag (1.1%). Since the original WWII alloy as per the
U.S. Red Book is Cu 56%, Ag 35% & Mn 9% this area analyzed is a Cu-rich,
Mn-rich and Ag poor region. As we investigate further, some regions are
Cu-rich, Ag-rich and Mn-rich. Since XRF scans deeper and wider than SEM/EDS it could
not pick up surface enriched Mn areas. Reviewing all the data and now with
SEM/EDS its clear Mn-oxides cause lamination issues due to its inability to mix
with Cu/Ag matrix and it's wanting to enrich the surface layer and here
combining with chlorine and sulfur further causing the immediate areas around
the Mn-rich areas to delaminate. In this study we confirm this further by
looking at the microstructure (400X magnification) for coin #1 (Figure 4-a). We
then look at the same microstructure area but at a greater magnification with
Point & ID Analysis at 1000X magnification level which is more readily able
to pick out the different metallurgical regions based on their light
intensities. The reader is asked to be patient as we proceed with this three-tier
system of Map Sum Summary/Microstructure/Point & ID Analysis which becomes clearer
to understand when we view all three tiers together.
Coin #1 Microstructure.
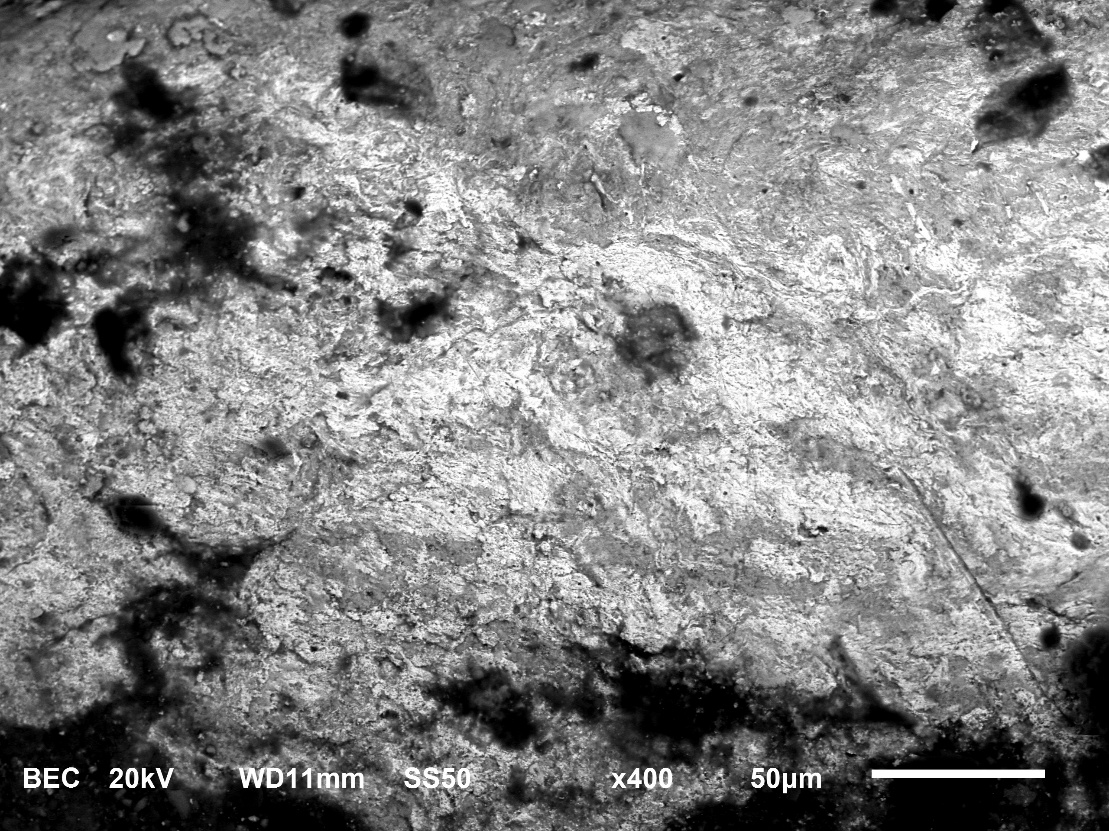
Figure 4-b: 400X Microstructure of Coin #1. Jefferson
Nickel. 1943-S 21.13 mm, 4.73 grams. The SEM microstructure of the WWII nickel
shows a surface dominated by irregular topography, granular deformation, and
scattered dark inclusions. At this magnification, the alloy's wrought nature is
immediately apparent: the surface is not smooth or cast-like but instead
displays elongated, mechanically worked features consistent with a struck
Cu-Ag-Mn alloy. The roughness is not random; it reflects the underlying
deformation bands created during minting, where the alloy was compressed and
stretched under die pressure.
Across the field, the darker regions represent lower-density
phases or oxide-rich zones, which are characteristic of manganese behavior in
war nickel metallurgy. Manganese segregates during solidification and later
oxidizes preferentially, forming stringer-like patches that appear darker in
backscattered electron mode. Mn also mixes with sulfur and chlorine further
delaminating the surface. These patches often align with micro-channels or
shallow pits, indicating localized corrosion where Mn-oxide networks have
broken down or detached over time. Their distribution is uneven, which is
typical for this alloy system. The lighter, brighter regions correspond to
higher-density metallic phases-primarily copper and silver-forming the
continuous matrix of the coin. Taken together, the microstructure reflects the
unique metallurgical fingerprint of WWII nickel alloying: a wrought Cu-Ag-Mn
matrix with oxide stringers, deformation bands, and corrosion-linked dark
inclusions. This sets the stage for the next figure, the Point & ID
analysis (Figure 4-c), which will isolate these contrasting regions and
quantify their elemental composition. That analysis will confirm the identity
of the dark manganese-oxide phases, the metallic matrix zones, and any trace
inclusions-linking visual microstructure directly to compositional evidence.
Coin #1 Point & ID Analysis
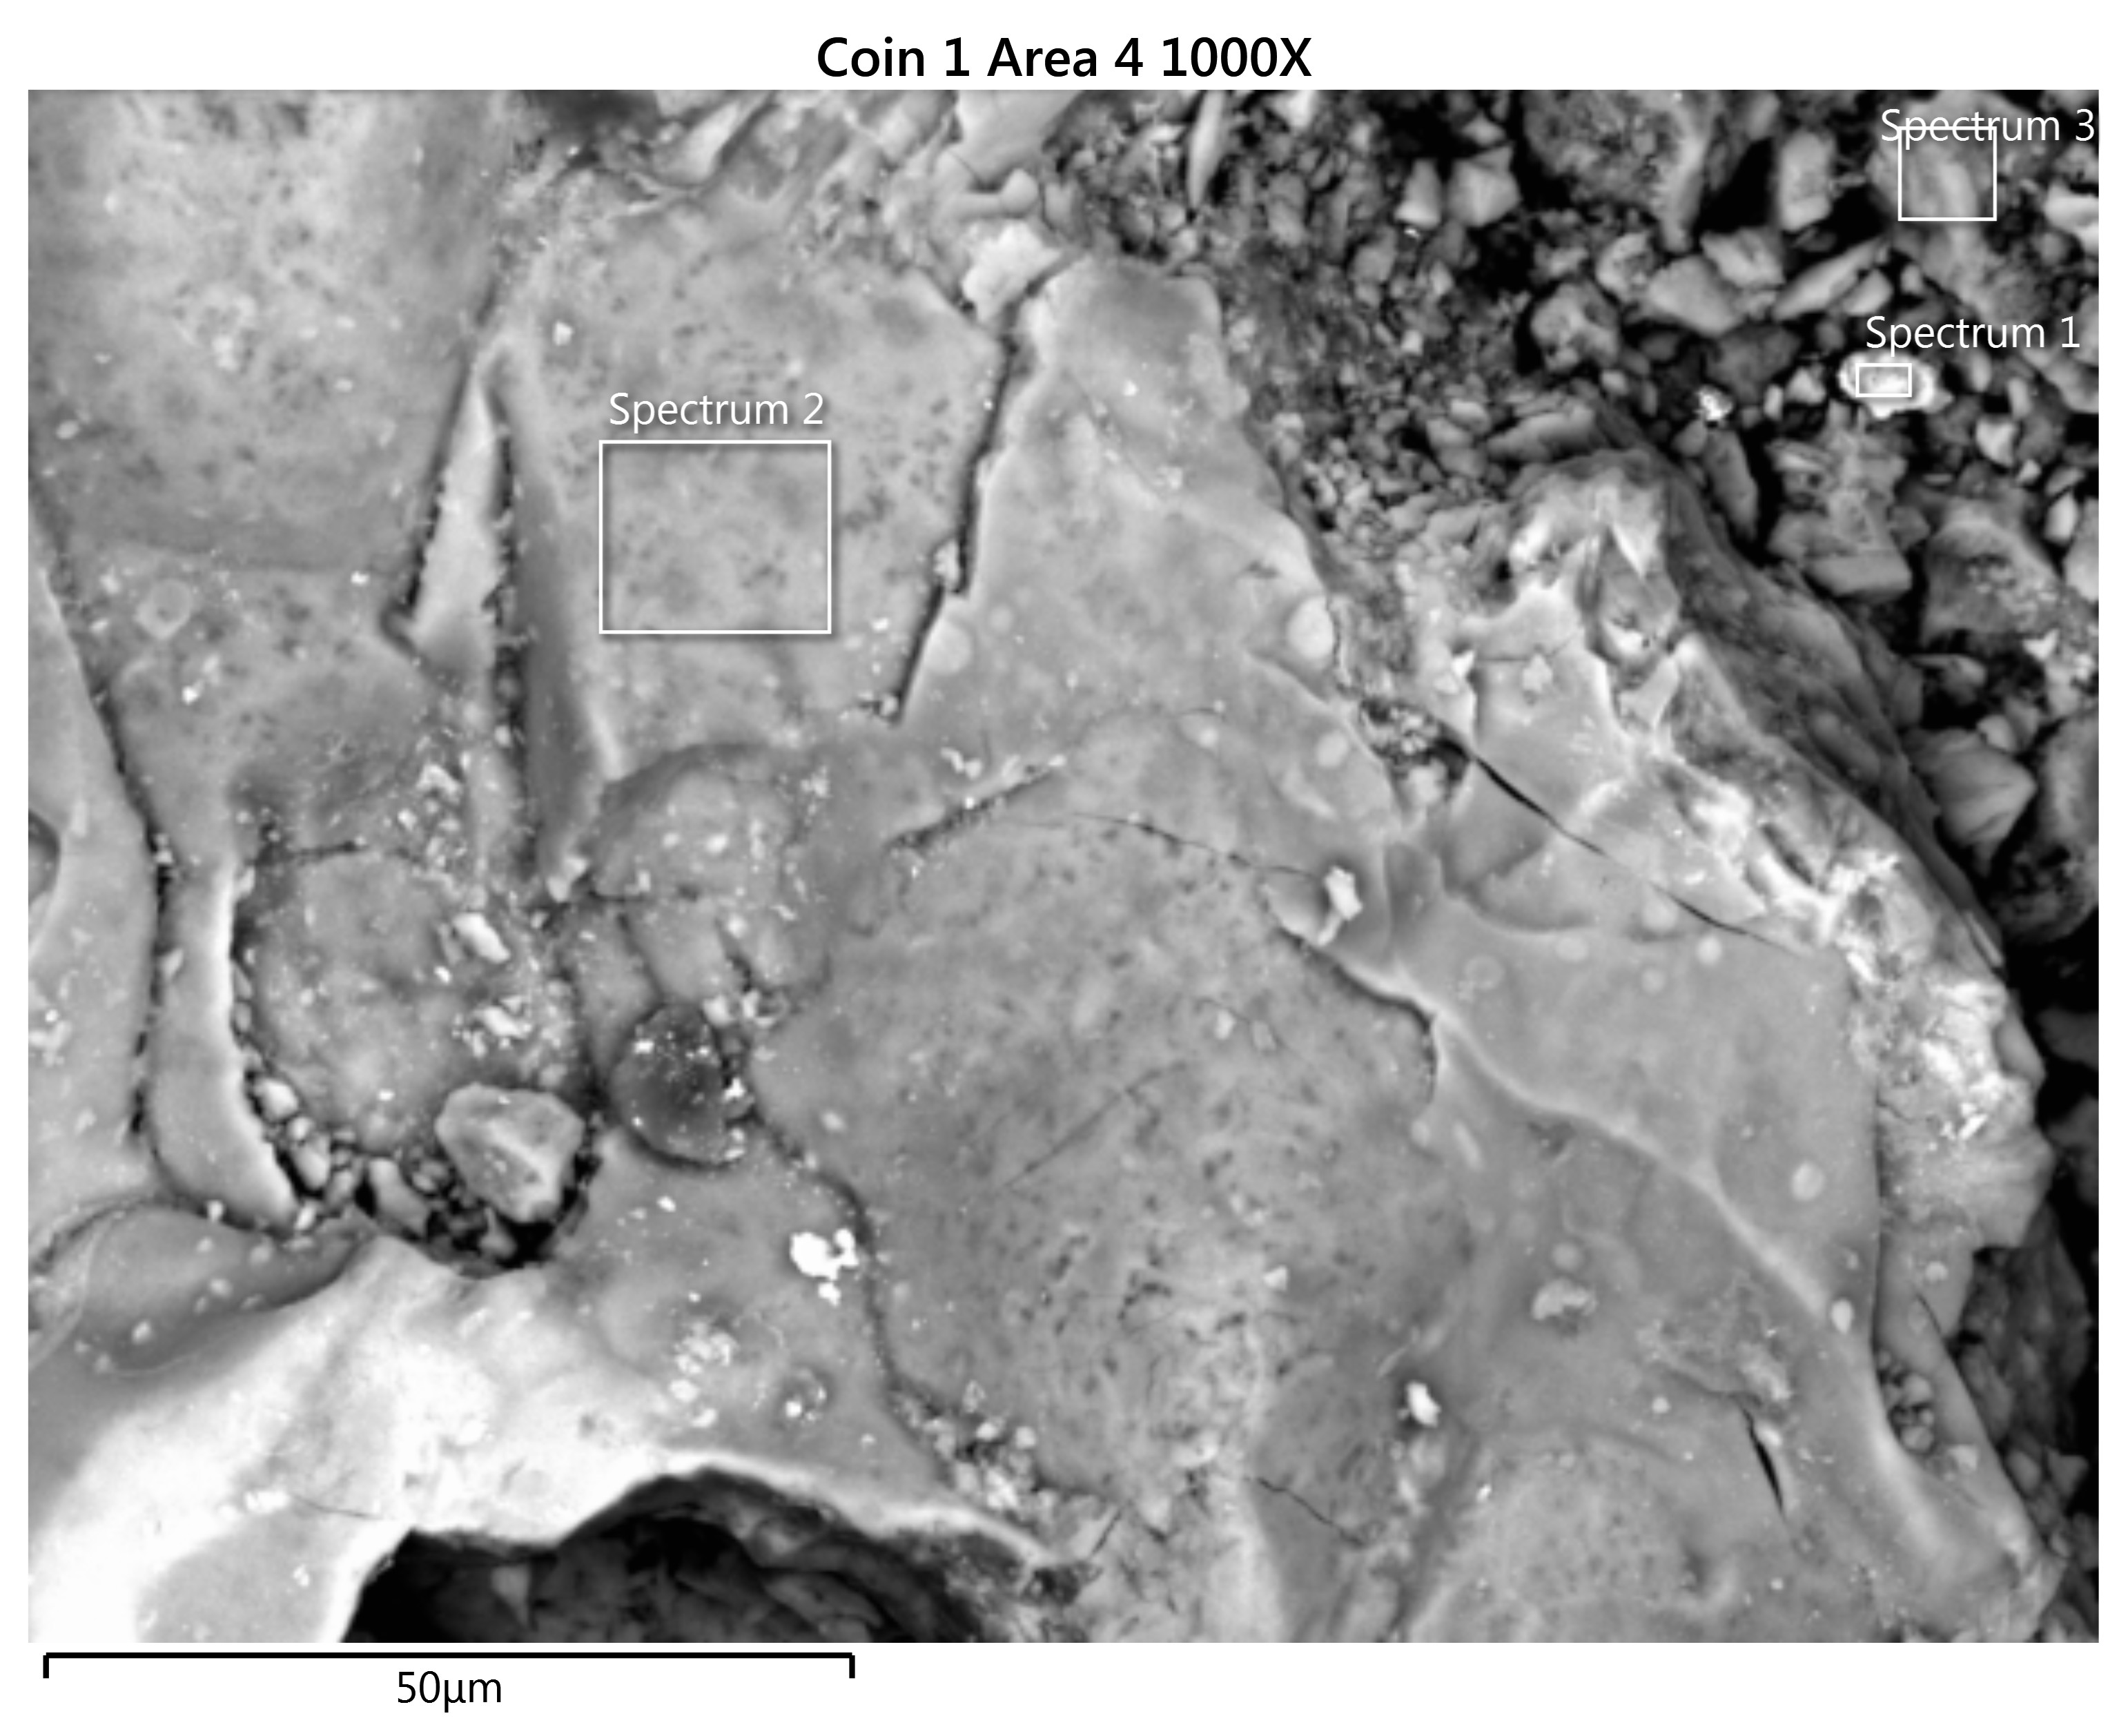
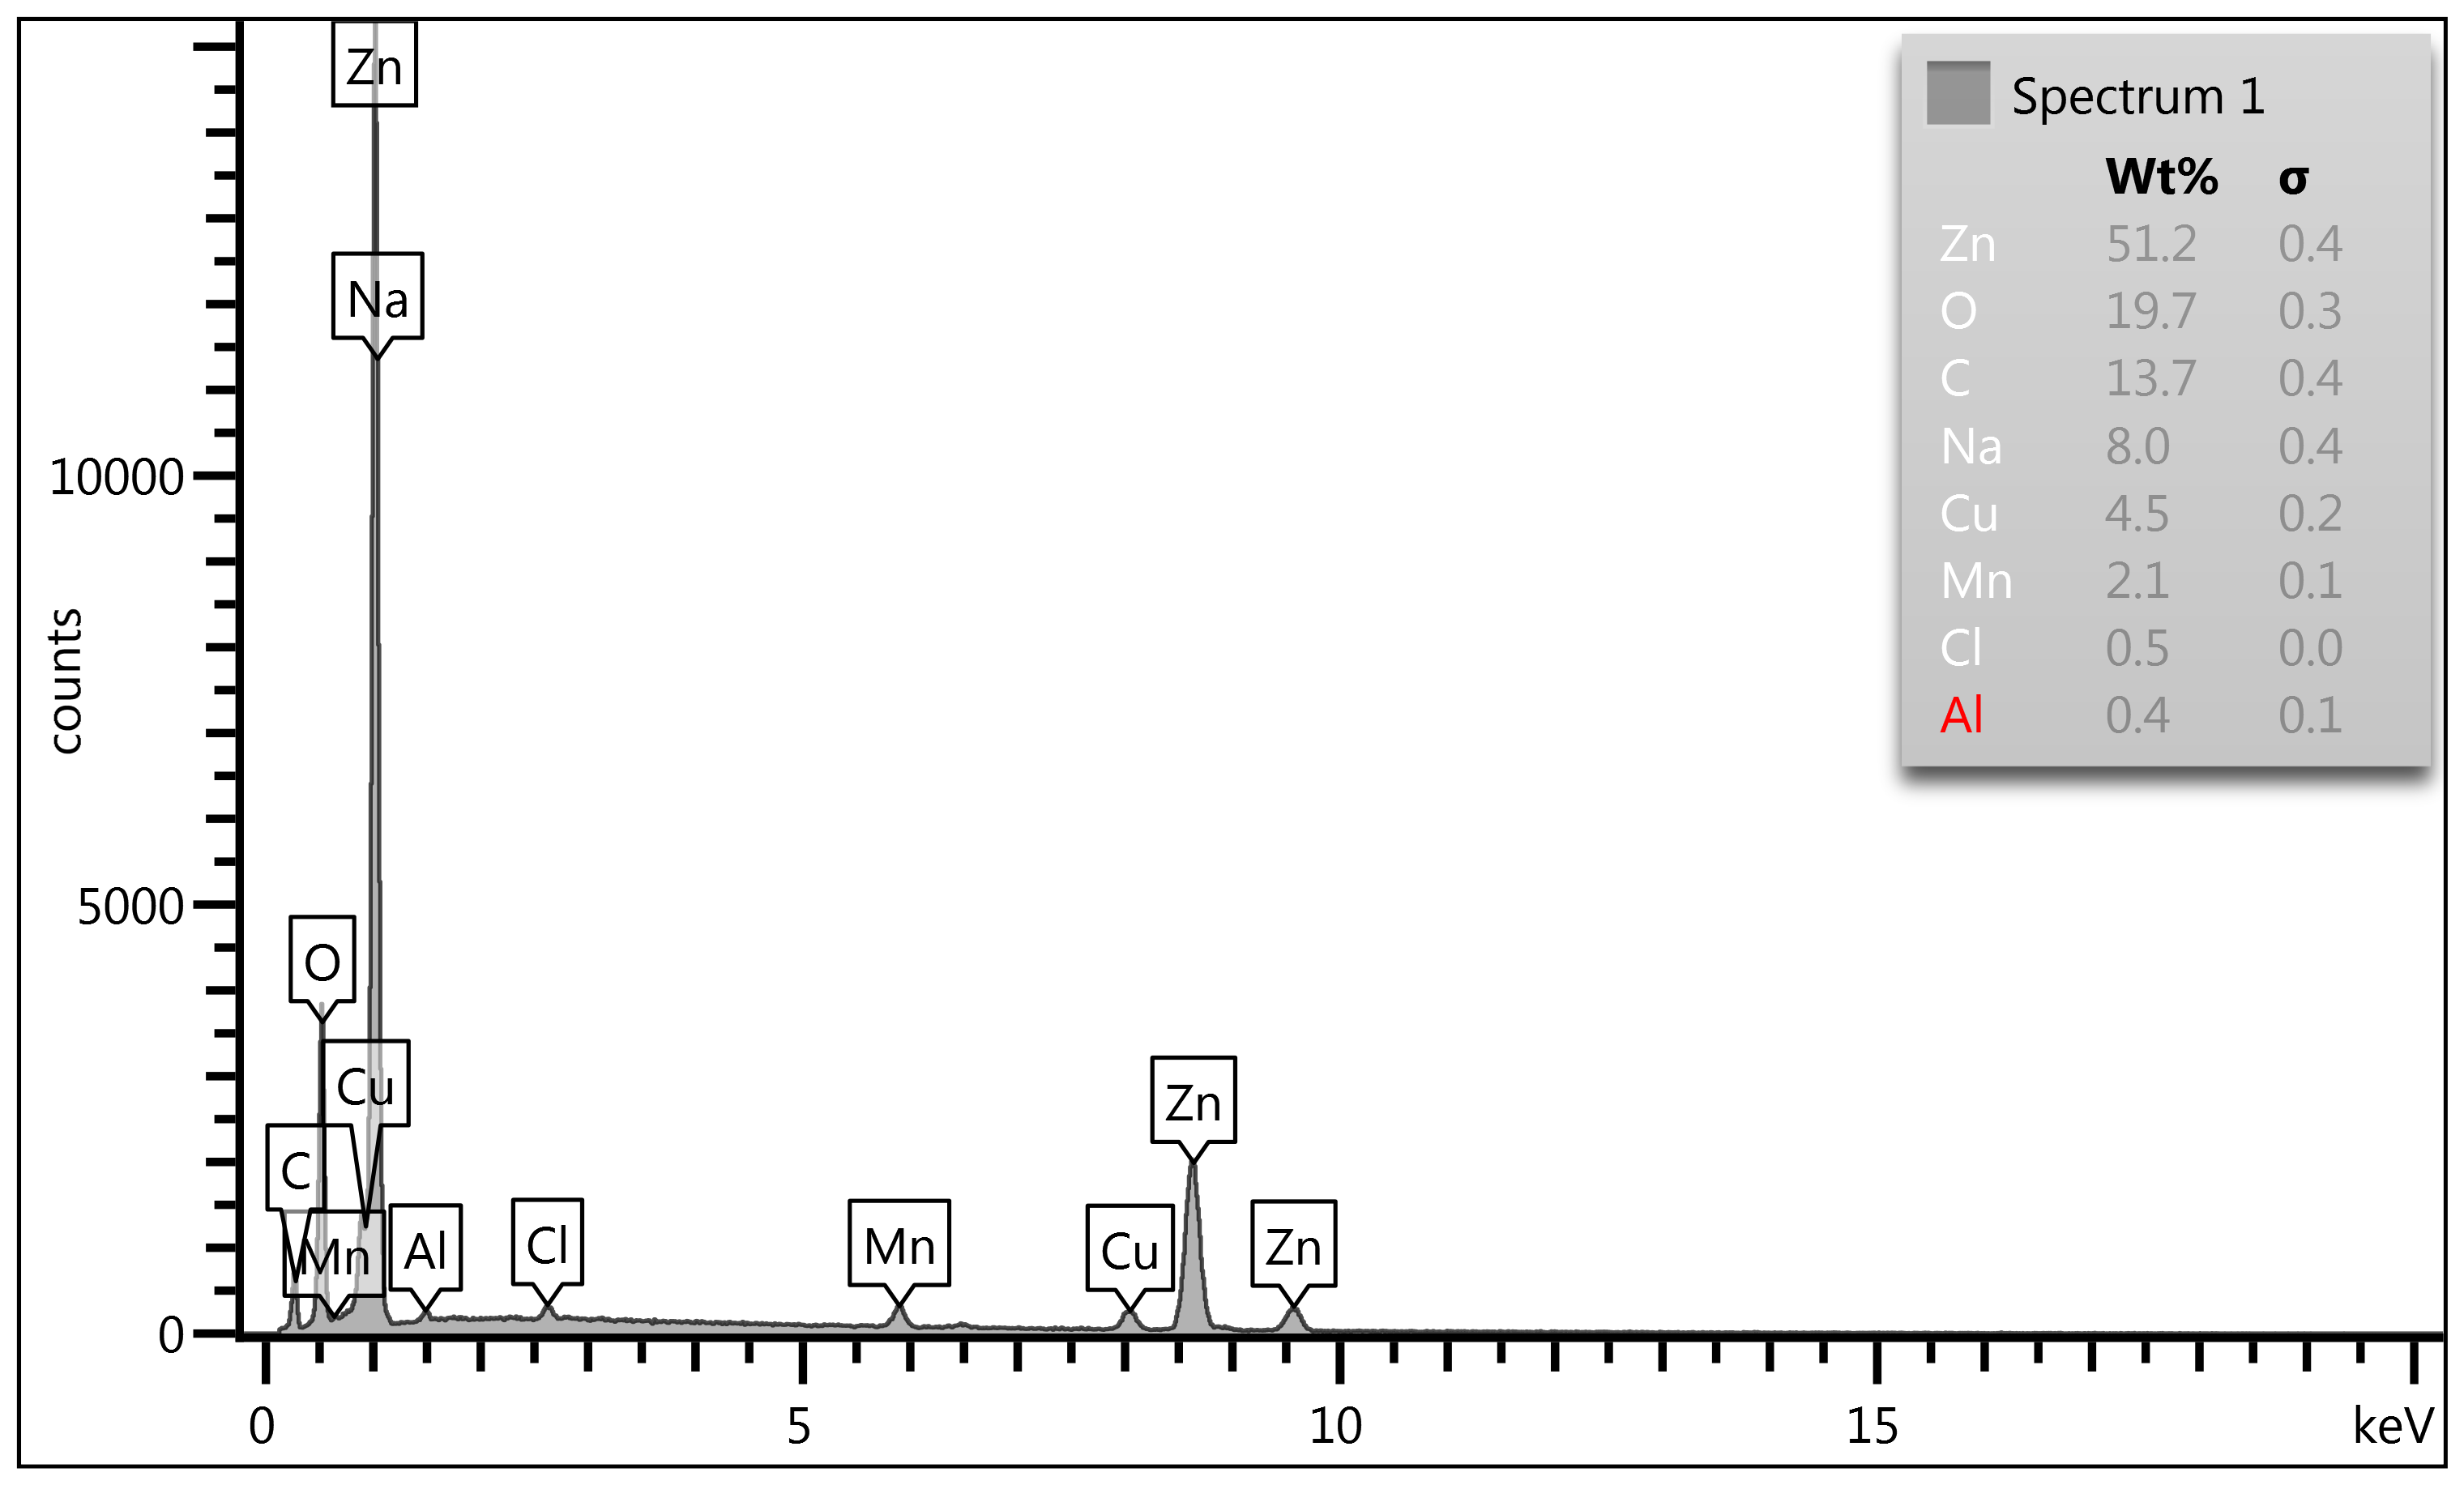
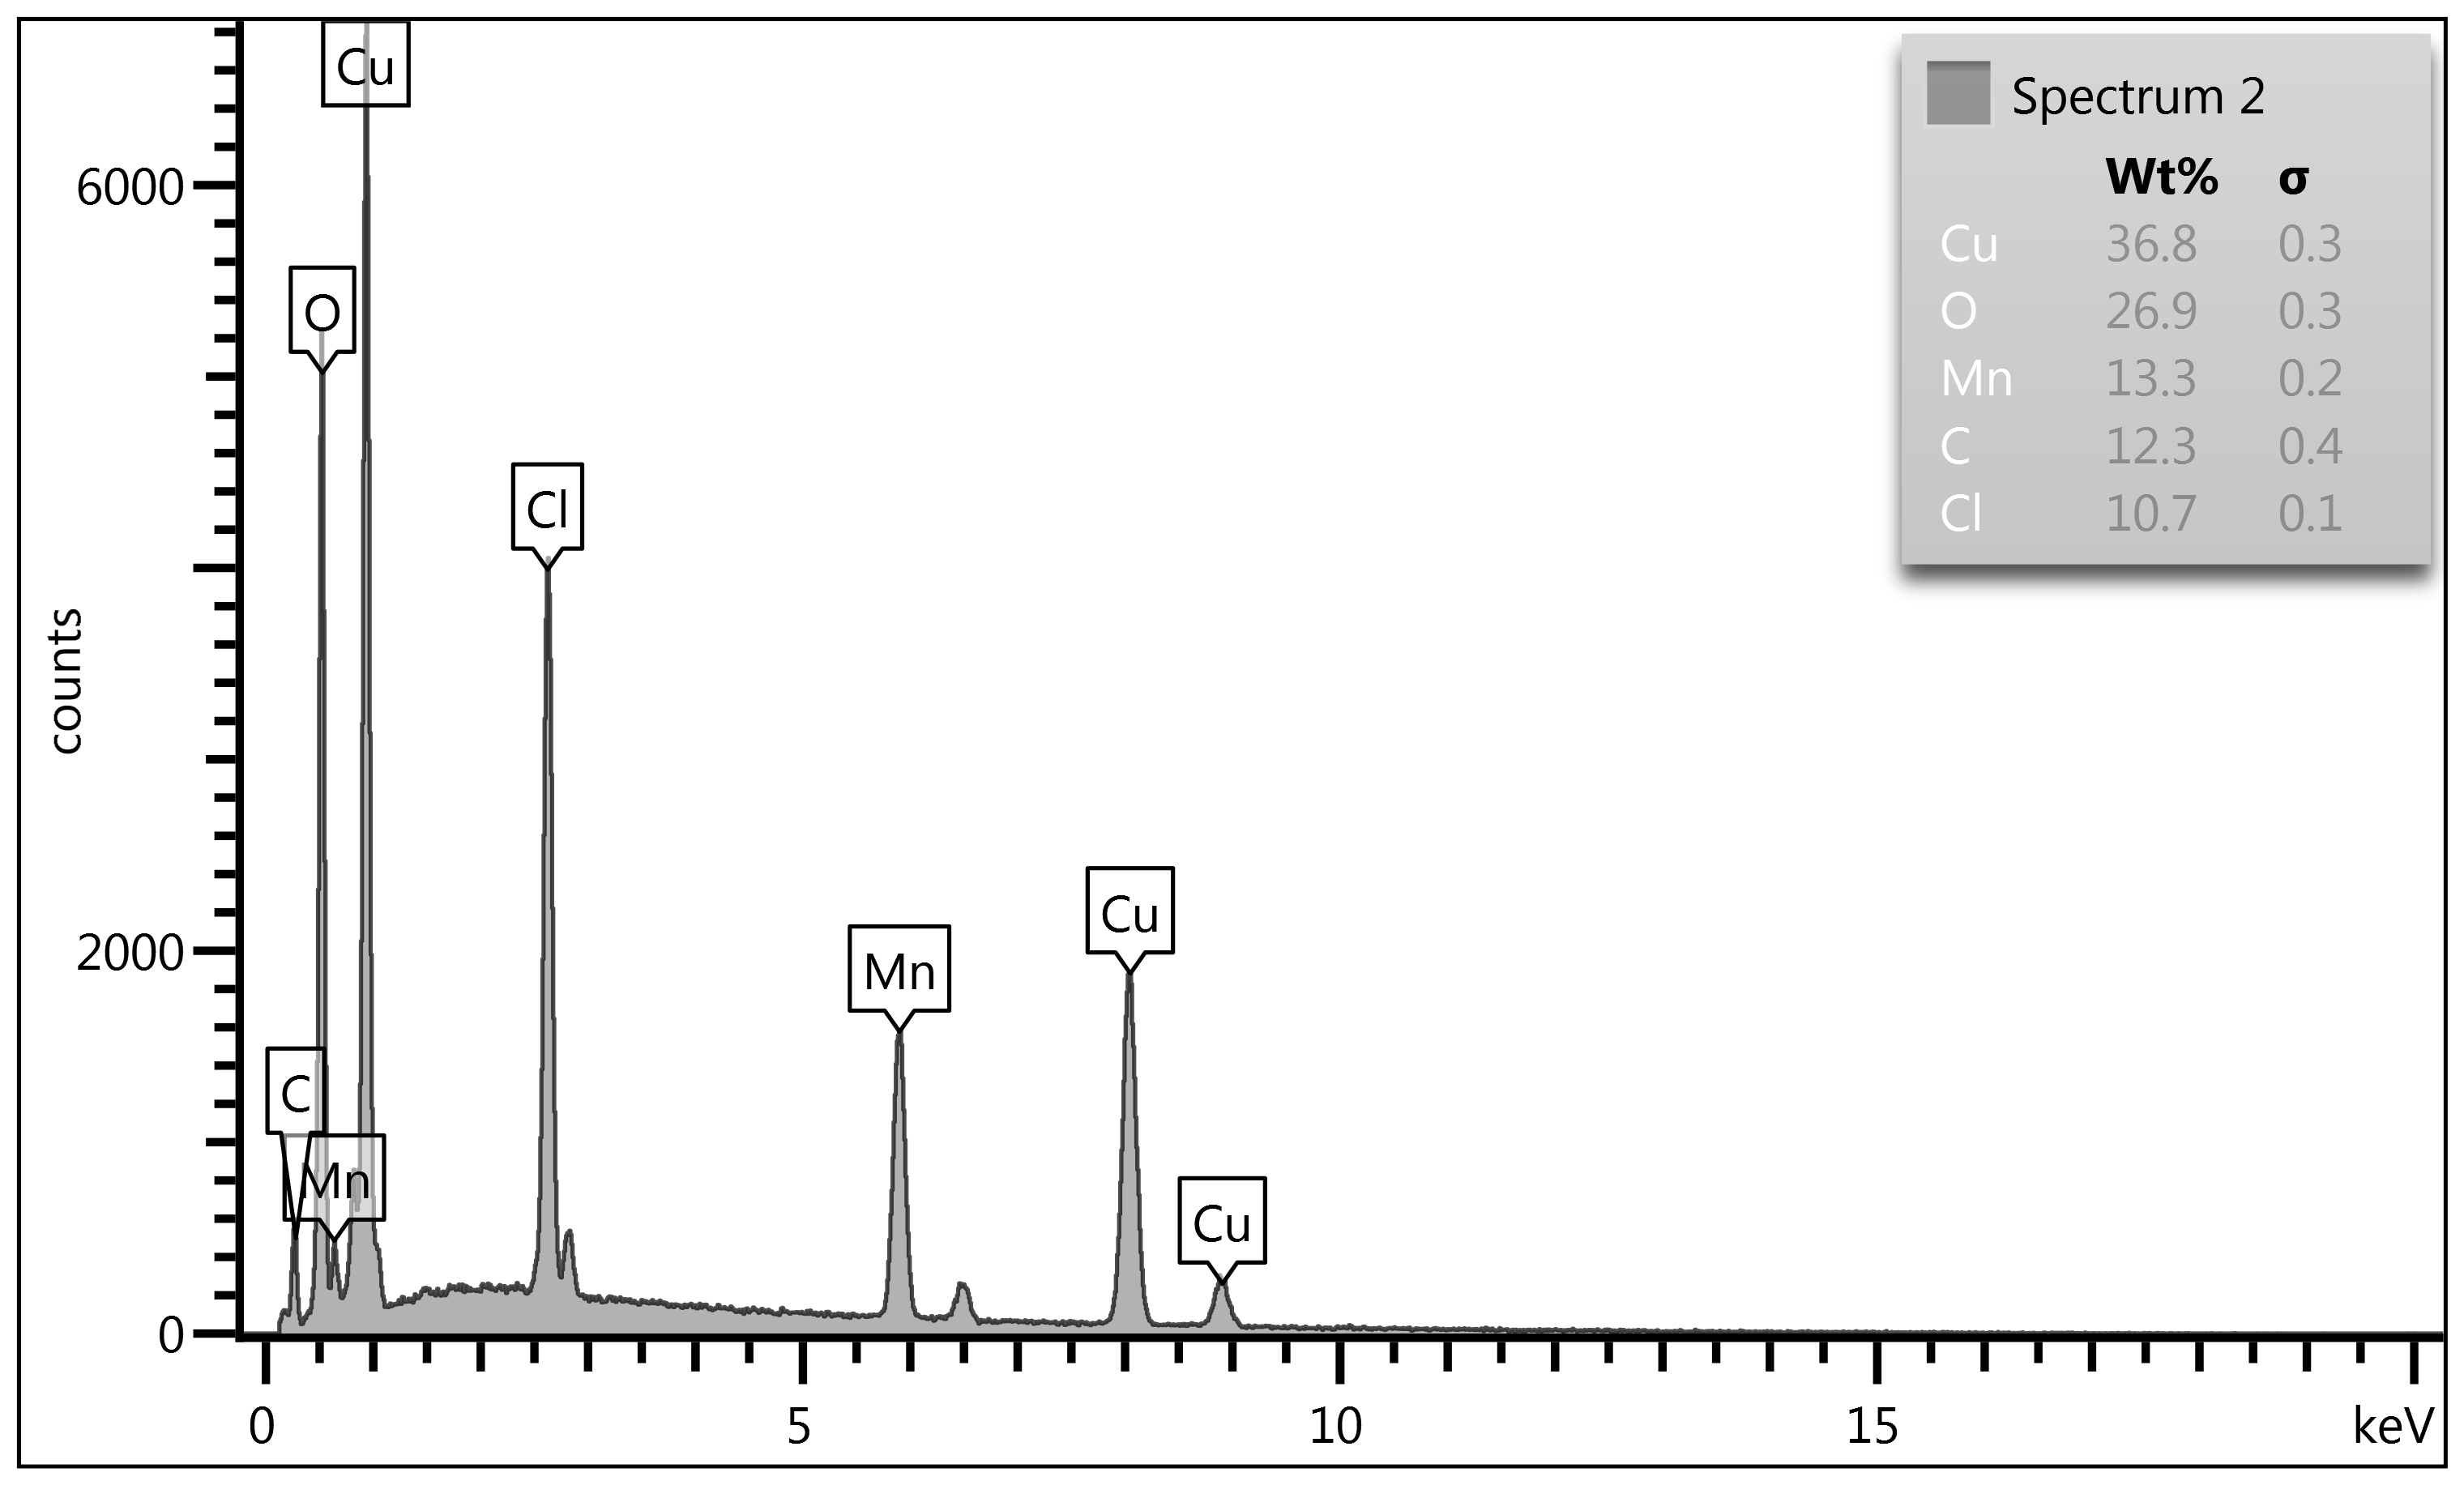
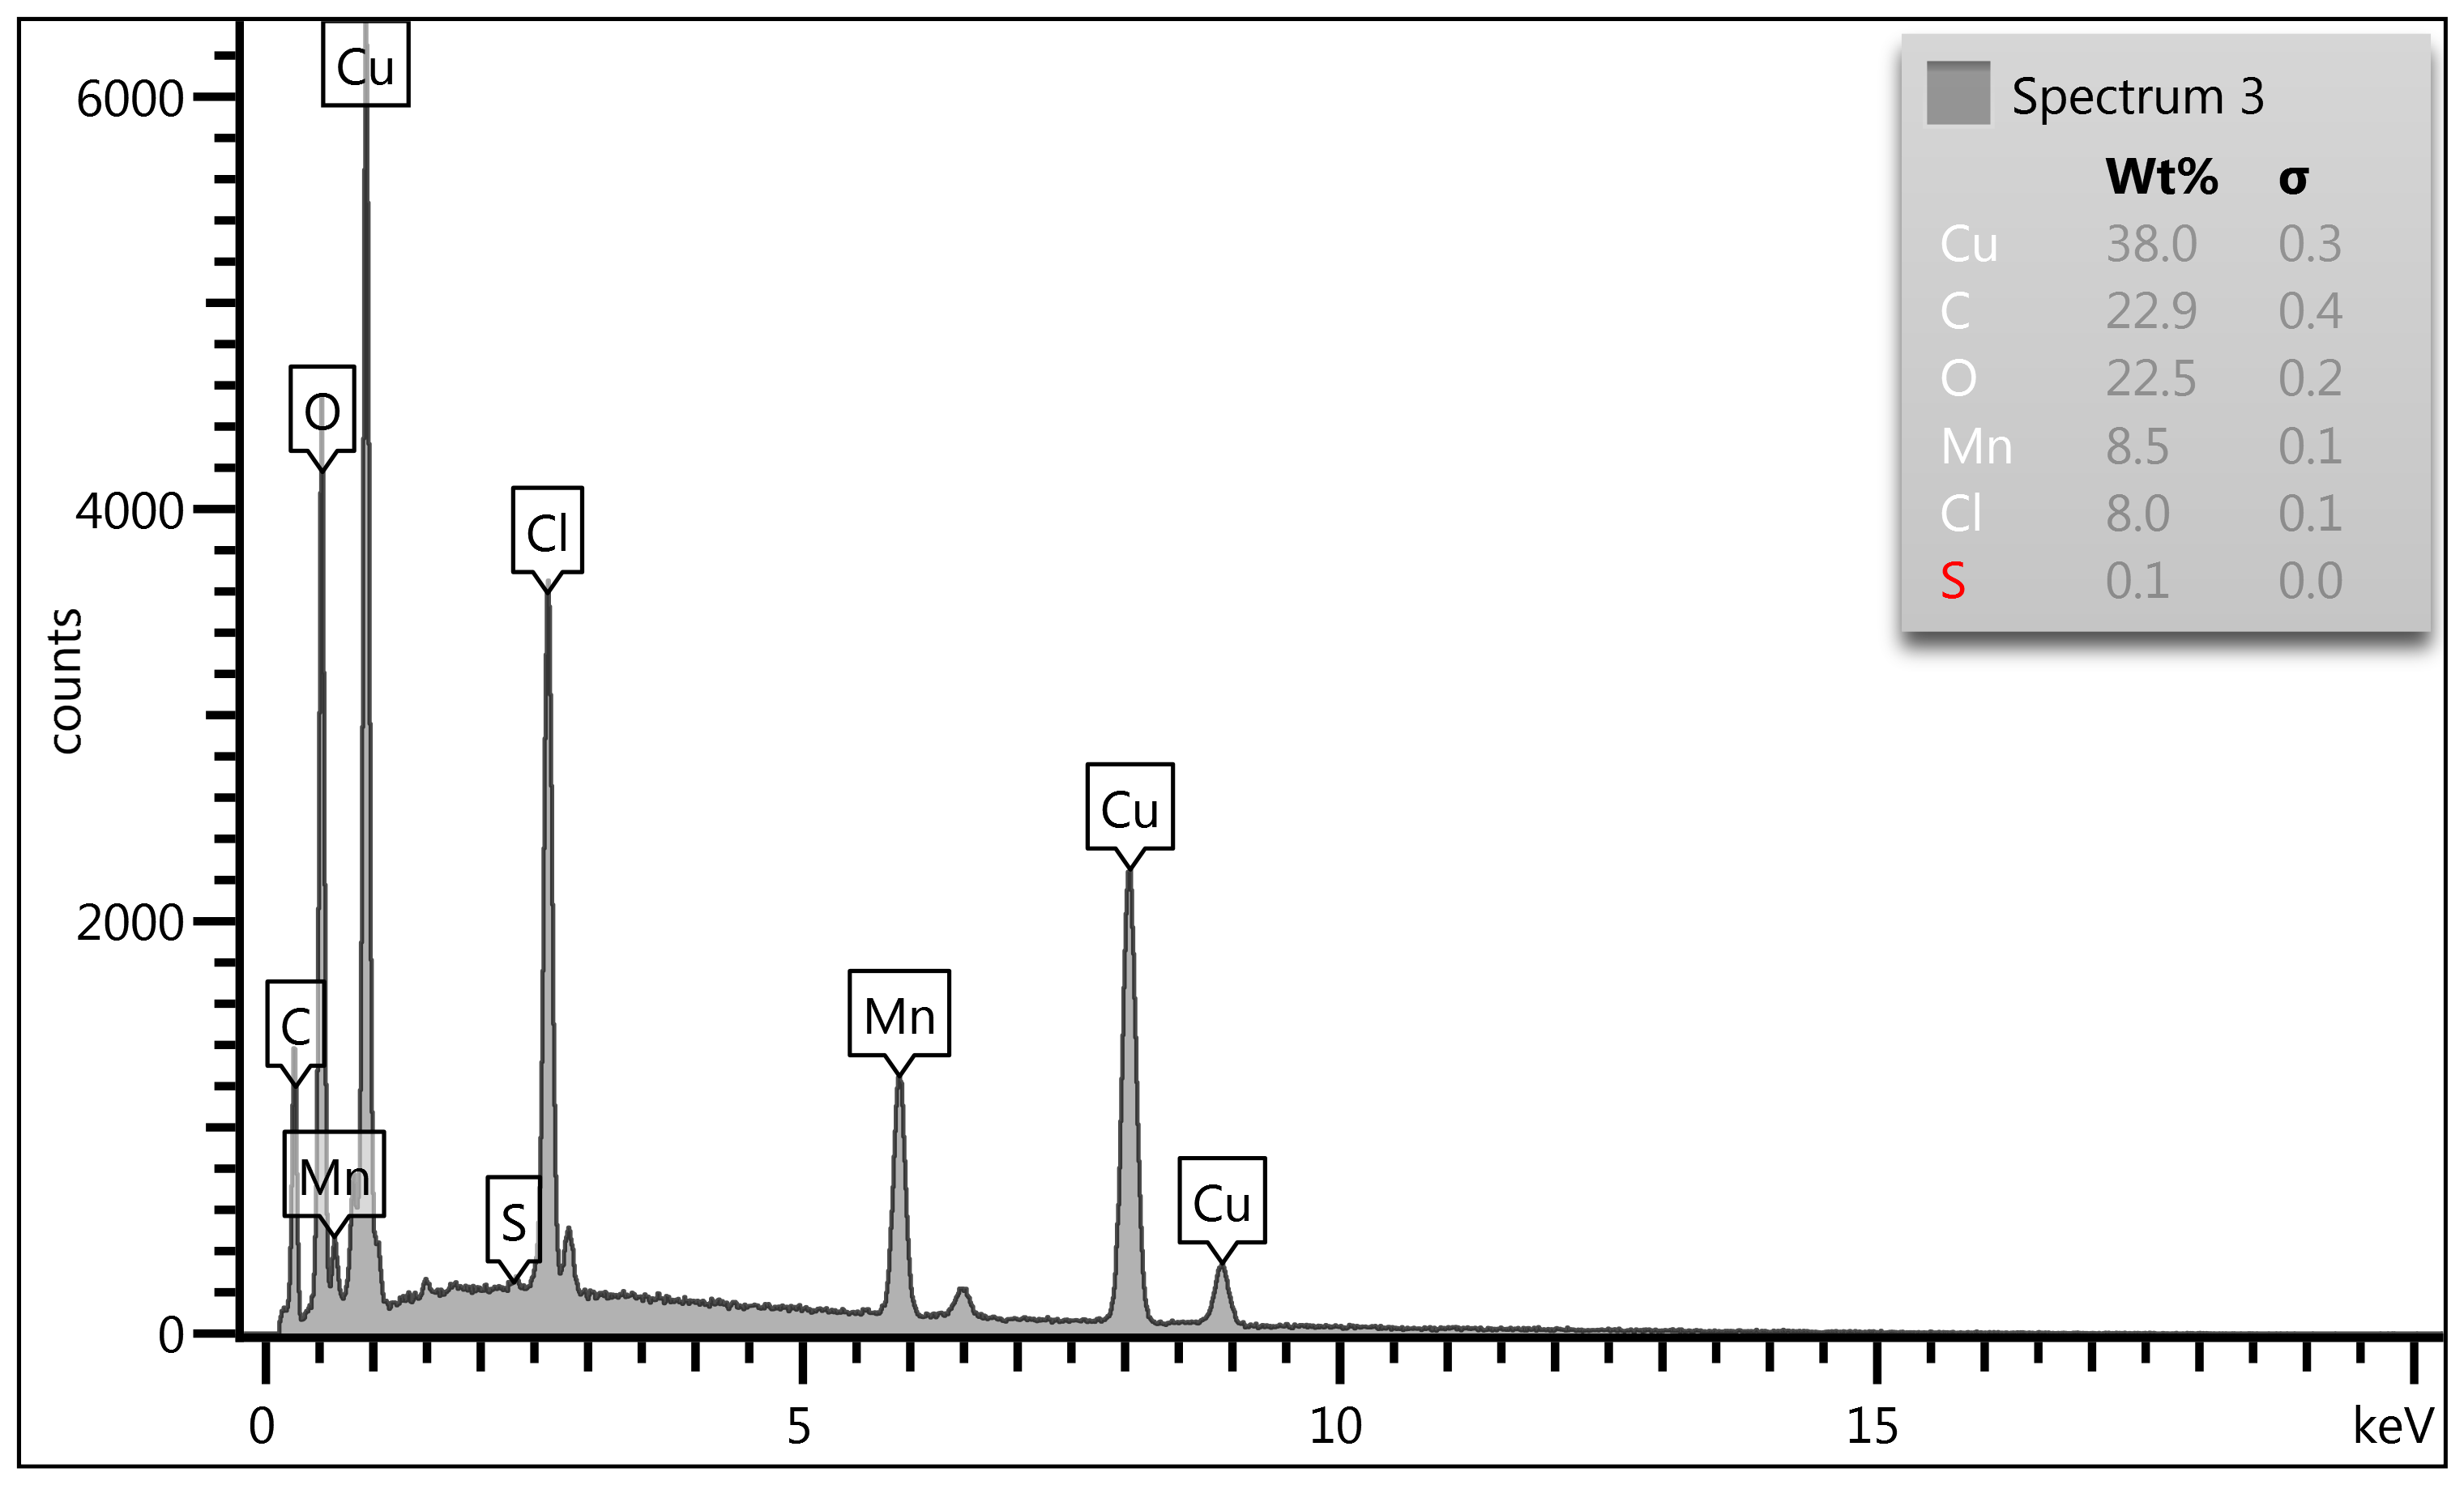
Figure 4-c: 1000X Point & ID Analysis of Coin #1.
Looking at different regions within this microstructure of coin #1 (Figure 2)
at a higher magnification we see in Spectrum #1 a Zn rich contamination/
corrosive zone not representative of the Cu/Ag/Zn alloy. Remembering the
surface area could not be polished as this would remove the Mn-oxide enriched
surface areas. So, this Spectrum #1 analysis area is not representative of the
coin's surface but simply a corrosion area.
Figure 4-c: 1000X Point & ID Analysis of Coin #1.
Continued: Spectrum #2 is monumental in terms of its finding as we see an
enriched Mn area along with copper and no silver. At this level we simply
picked up an area of mostly copper with a total lack of silver in this analysis
area. However, the high Mn level and if C & O is extrapolated out and
combined with the copper, manganese and chlorine equally we have Cu (60.5%), Mn
(21.8%) & Cl (17.6%). Spectrum #2 indicates Mn is migrating to the surface and
enriching the surface and combining with chlorine in this case an environmental
contaminant. We will again see this in Spectrum #3 where Mn is reported at 8.5%
but its extrapolated value factoring C & O reacting equally with Cu, Mn, Cl
& S we see Mn value at 15.6%.
Overall Assessment of Coin #1 - Jefferson Nickel. 1943-S,
21.13 mm, 4.73 grams:
Coin #1's combined Map Sum Summary, Microstructure, and
Point & ID results show a surface that has been fundamentally altered by
manganese behavior within the wartime Cu-Ag matrix. The elemental maps
demonstrate that Mn does not remain uniformly dissolved; instead, it segregates
out of the metallic matrix during solidification and later migrates toward the
surface (i.e., surface enrichment). Once exposed, Mn oxidizes aggressively,
forming Mn-oxide networks that enrich the outer layers and interact with sulfur
and chlorine contaminants (S & Cl) introduced primarily environmentally.
These reactions create mixed Mn-S-Cl corrosion complexes that expand, lift, and
undermine the surrounding Cu/Ag matrix. The SEM microstructure confirms this:
dark, fractured stringer phases and void-adjacent channels mark areas where Mn-oxide
sheets have grown and then detached. Point & ID readings reinforce the same
story, showing Mn-rich zones at the upper surface and depleted metallic regions
beneath. Together, the data explains the delamination seen on Coin #1 - a
surface peeled away not by mechanical damage, but by Mn separating from the Cu/Ag
matrix, oxidizing, reacting with S & Cl, and ultimately breaking the coin's
outer layer apart.
Coin #2 Map Sum Summary
|
Element
|
Line
Type
|
Apparent
Concentration
|
k
Ratio
|
Wt%
|
Wt%
Sigma
|
Standard
Label
|
Factory
Standard
|
|
C
|
K
series
|
1.27
|
0.01271
|
10.10
|
0.28
|
C
Vit
|
Yes
|
|
O
|
K
series
|
3.52
|
0.01185
|
15.14
|
0.27
|
SiO2
|
Yes
|
|
Si
|
K
series
|
0.07
|
0.00055
|
0.22
|
0.04
|
SiO2
|
Yes
|
|
Cl
|
K
series
|
0.23
|
0.00200
|
0.54
|
0.05
|
NaCl
|
Yes
|
|
Mn
|
K
series
|
1.53
|
0.01526
|
3.81
|
0.11
|
Mn
|
Yes
|
|
Cu
|
K
series
|
12.95
|
0.12946
|
32.07
|
0.28
|
Cu
|
Yes
|
|
Ag
|
L
series
|
14.48
|
0.14479
|
38.11
|
0.28
|
Ag
|
Yes
|
|
Total:
|
|
|
|
100.00
|
|
|
|
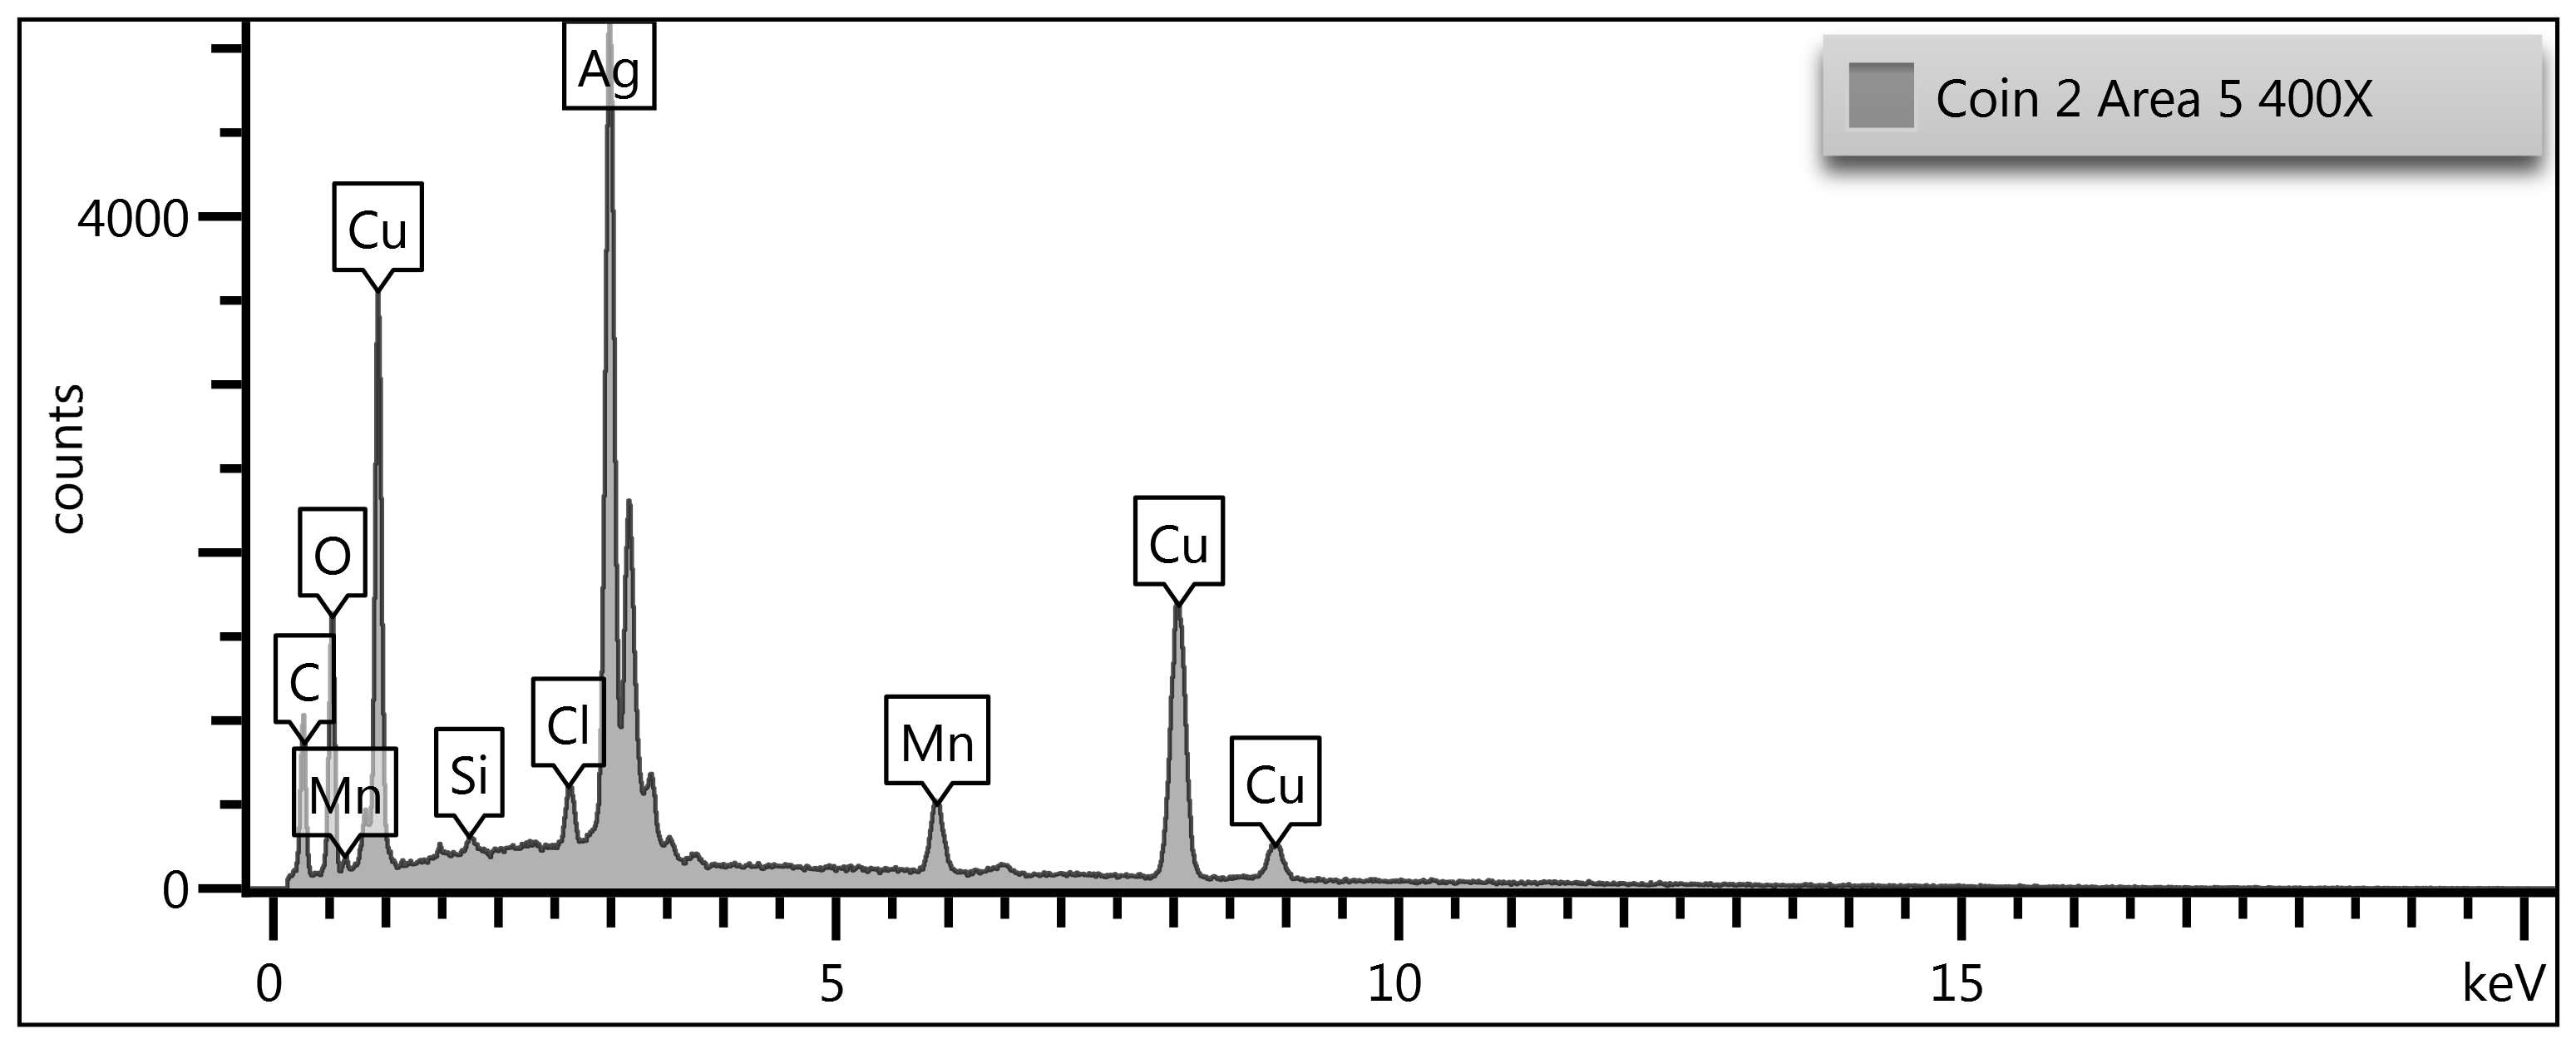
Figure 5-a Jefferson Nickel. 1943-P 21.11 mm, 4.73 grams.
We see contaminants of silicon (Si) and chlorine (Cl) on the surface. Trace
arsenic on a WWII nickel surface is fully consistent with the metallurgy and
industrial sourcing of the Cu/Ag/Mn alloy used by the U.S. Mint between
1942-1945. Silicon was not intentionally added; instead, it entered the
melt through impurities in wartime copper and silver feedstock, which
often came from recycled electrical wire, industrial scrap, and repurposed
bullion. These materials routinely carried ppm-level Si from earlier
refining practices, ore-origin contamination, or prior alloying histories. When
the Cu/Ag/Mn melt was prepared, silicon-being more soluble in copper than
manganese-remained dissolved in the metallic matrix but later migrated toward
the surface during oxidation cycles. Mn segregation and oxide formation created
reactive pathways that pulled trace As into the outer corrosion films, where it
becomes detectable in SEM/EDS Point & ID scans. In short, the silicon we
are seeing is a legacy impurity from recycled wartime feedstock,
mobilized and surface-enriched by the same Mn-oxide behavior that defines war
nickel corrosion. When carbon and oxygen is factored into
Cu/Ag/Mn mixing equally we get Mn (5.1%), Cu (42.9%) & Ag (51.0%). This
target point shows a more representative mix of Mn/Cu/Ag matrix. The next
figure in the triple tier analysis Figure 5-b illustrates the microstructure of
this area.
Microstructure of Coin #2
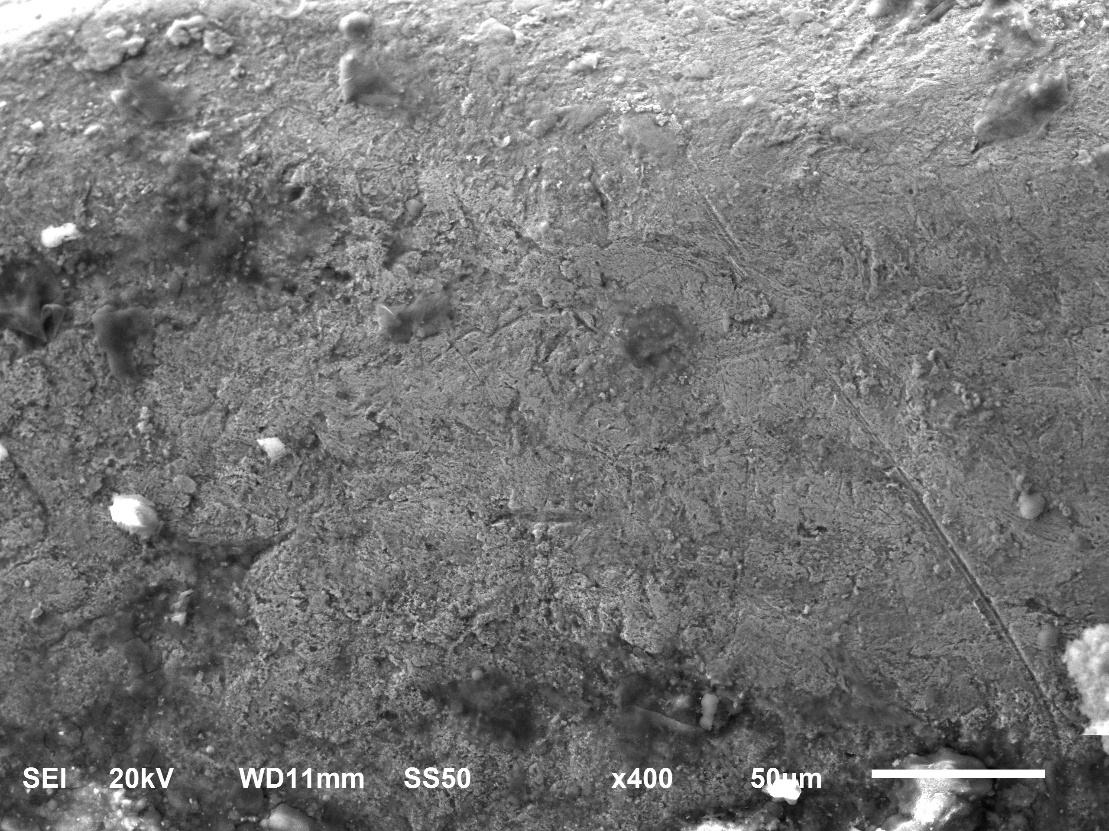
Figure 5-b 400X Microstructure of Coin #2 Jefferson
Nickel. 1943-P 21.11 mm, 4.73 grams.
The SEM microstructure of this 1943 WWII Jefferson nickel
shows a surface dominated by irregular granular features, fractured oxide
patches, and deformation bands typical of a struck Cu-Ag-Mn alloy. The bright
metallic regions represent the Cu/Ag matrix, while the darker, more fractured
zones correspond to manganese-rich oxides that have migrated and reacted at the
surface. The rough, discontinuous topography reflects long-term corrosion
pathways driven by Mn segregation, where Mn leaves the metallic matrix and
forms brittle surface films that crack, lift, and expose underlying metal.
Nothing in the field suggests casting; morphology is fully consistent with
wrought Mint production.
The Map Summary values-Mn 5.1%, Cu 42.9%, Ag 50.98%-show how
the surface composition has shifted from the Red Book alloy (Cu 56%, Ag 35%, Mn
9%). This is not an alloying error; it is the predictable result of decades of
Mn migration and oxidation. Mn preferentially segregates out of the Cu/Ag
matrix, forming surface-rich Mn-oxide networks that later break down and
detach. As these Mn-oxide films delaminate, they expose Ag-rich subsurface
metal, which explains the elevated Ag reading. Meanwhile, Cu is depleted at the
surface because Mn-oxide formation disrupts the Cu matrix and accelerates
localized corrosion. The SEM image captures this process directly: dark Mn-oxide
stringers, void-adjacent channels, and lifted surface sheets that reflect Mn's
long-term chemical mobility.
Point & ID
Analysis of Coin #2
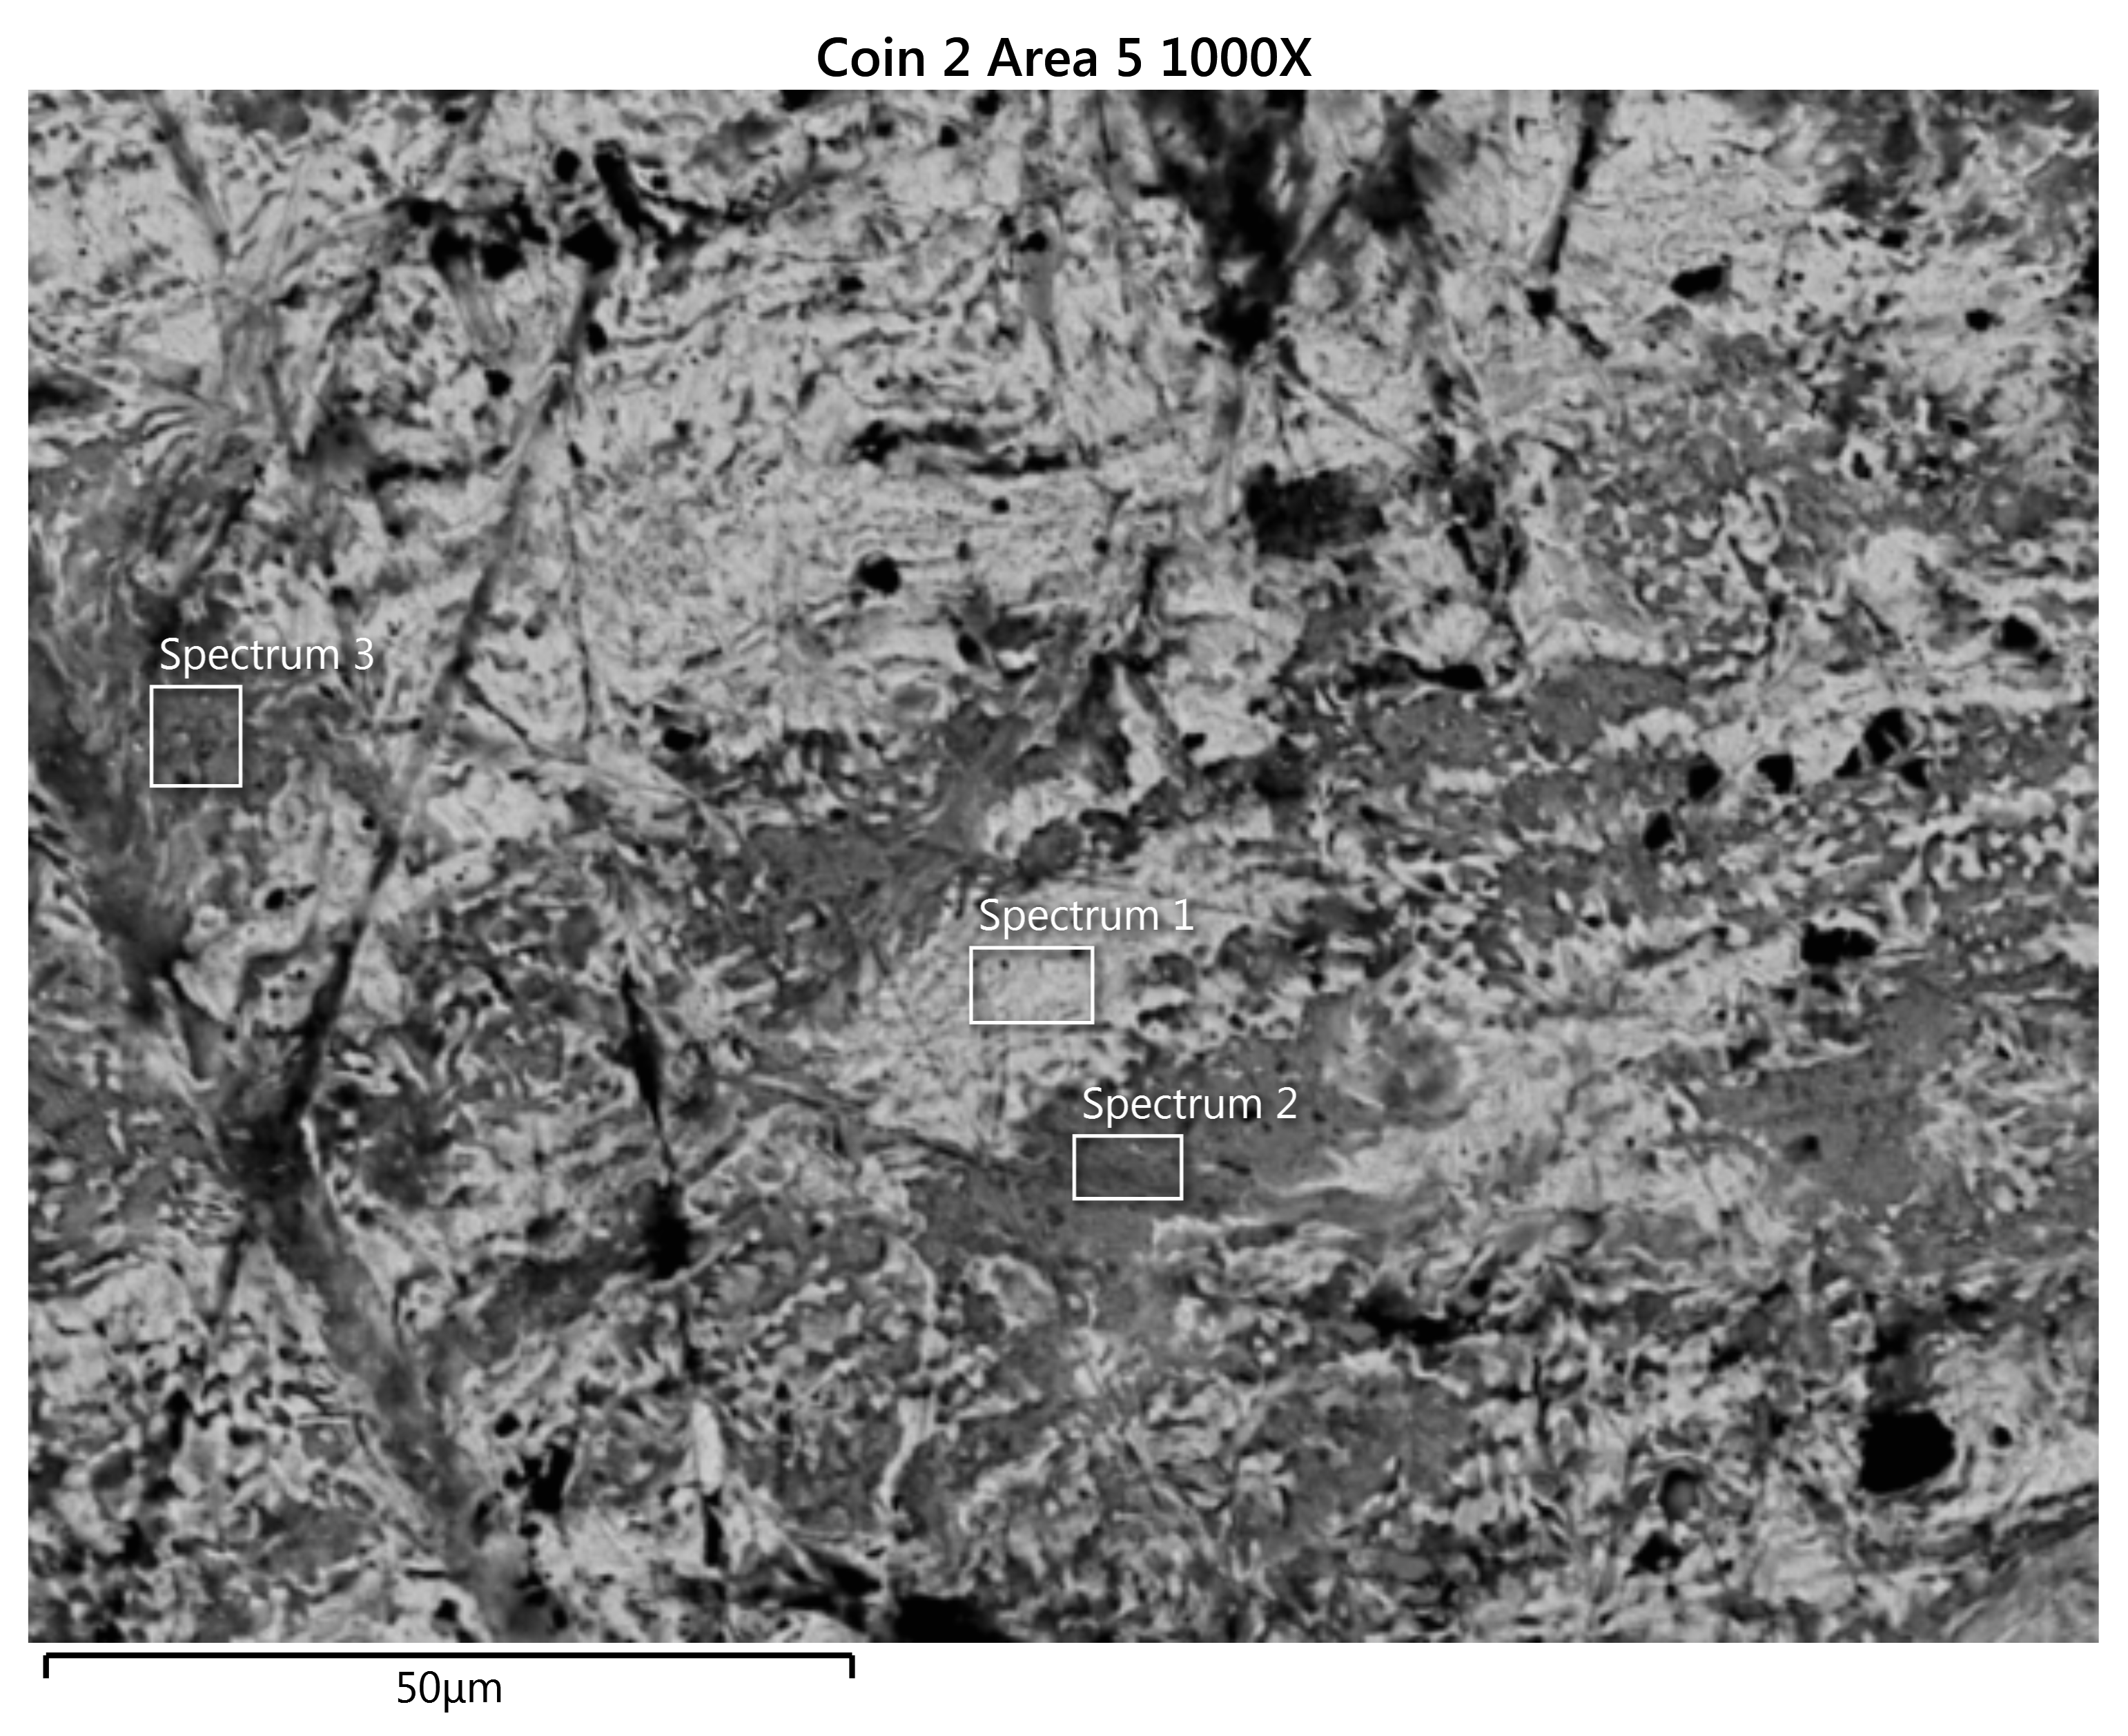
Point & ID Analysis of Coin #2 (Continued)
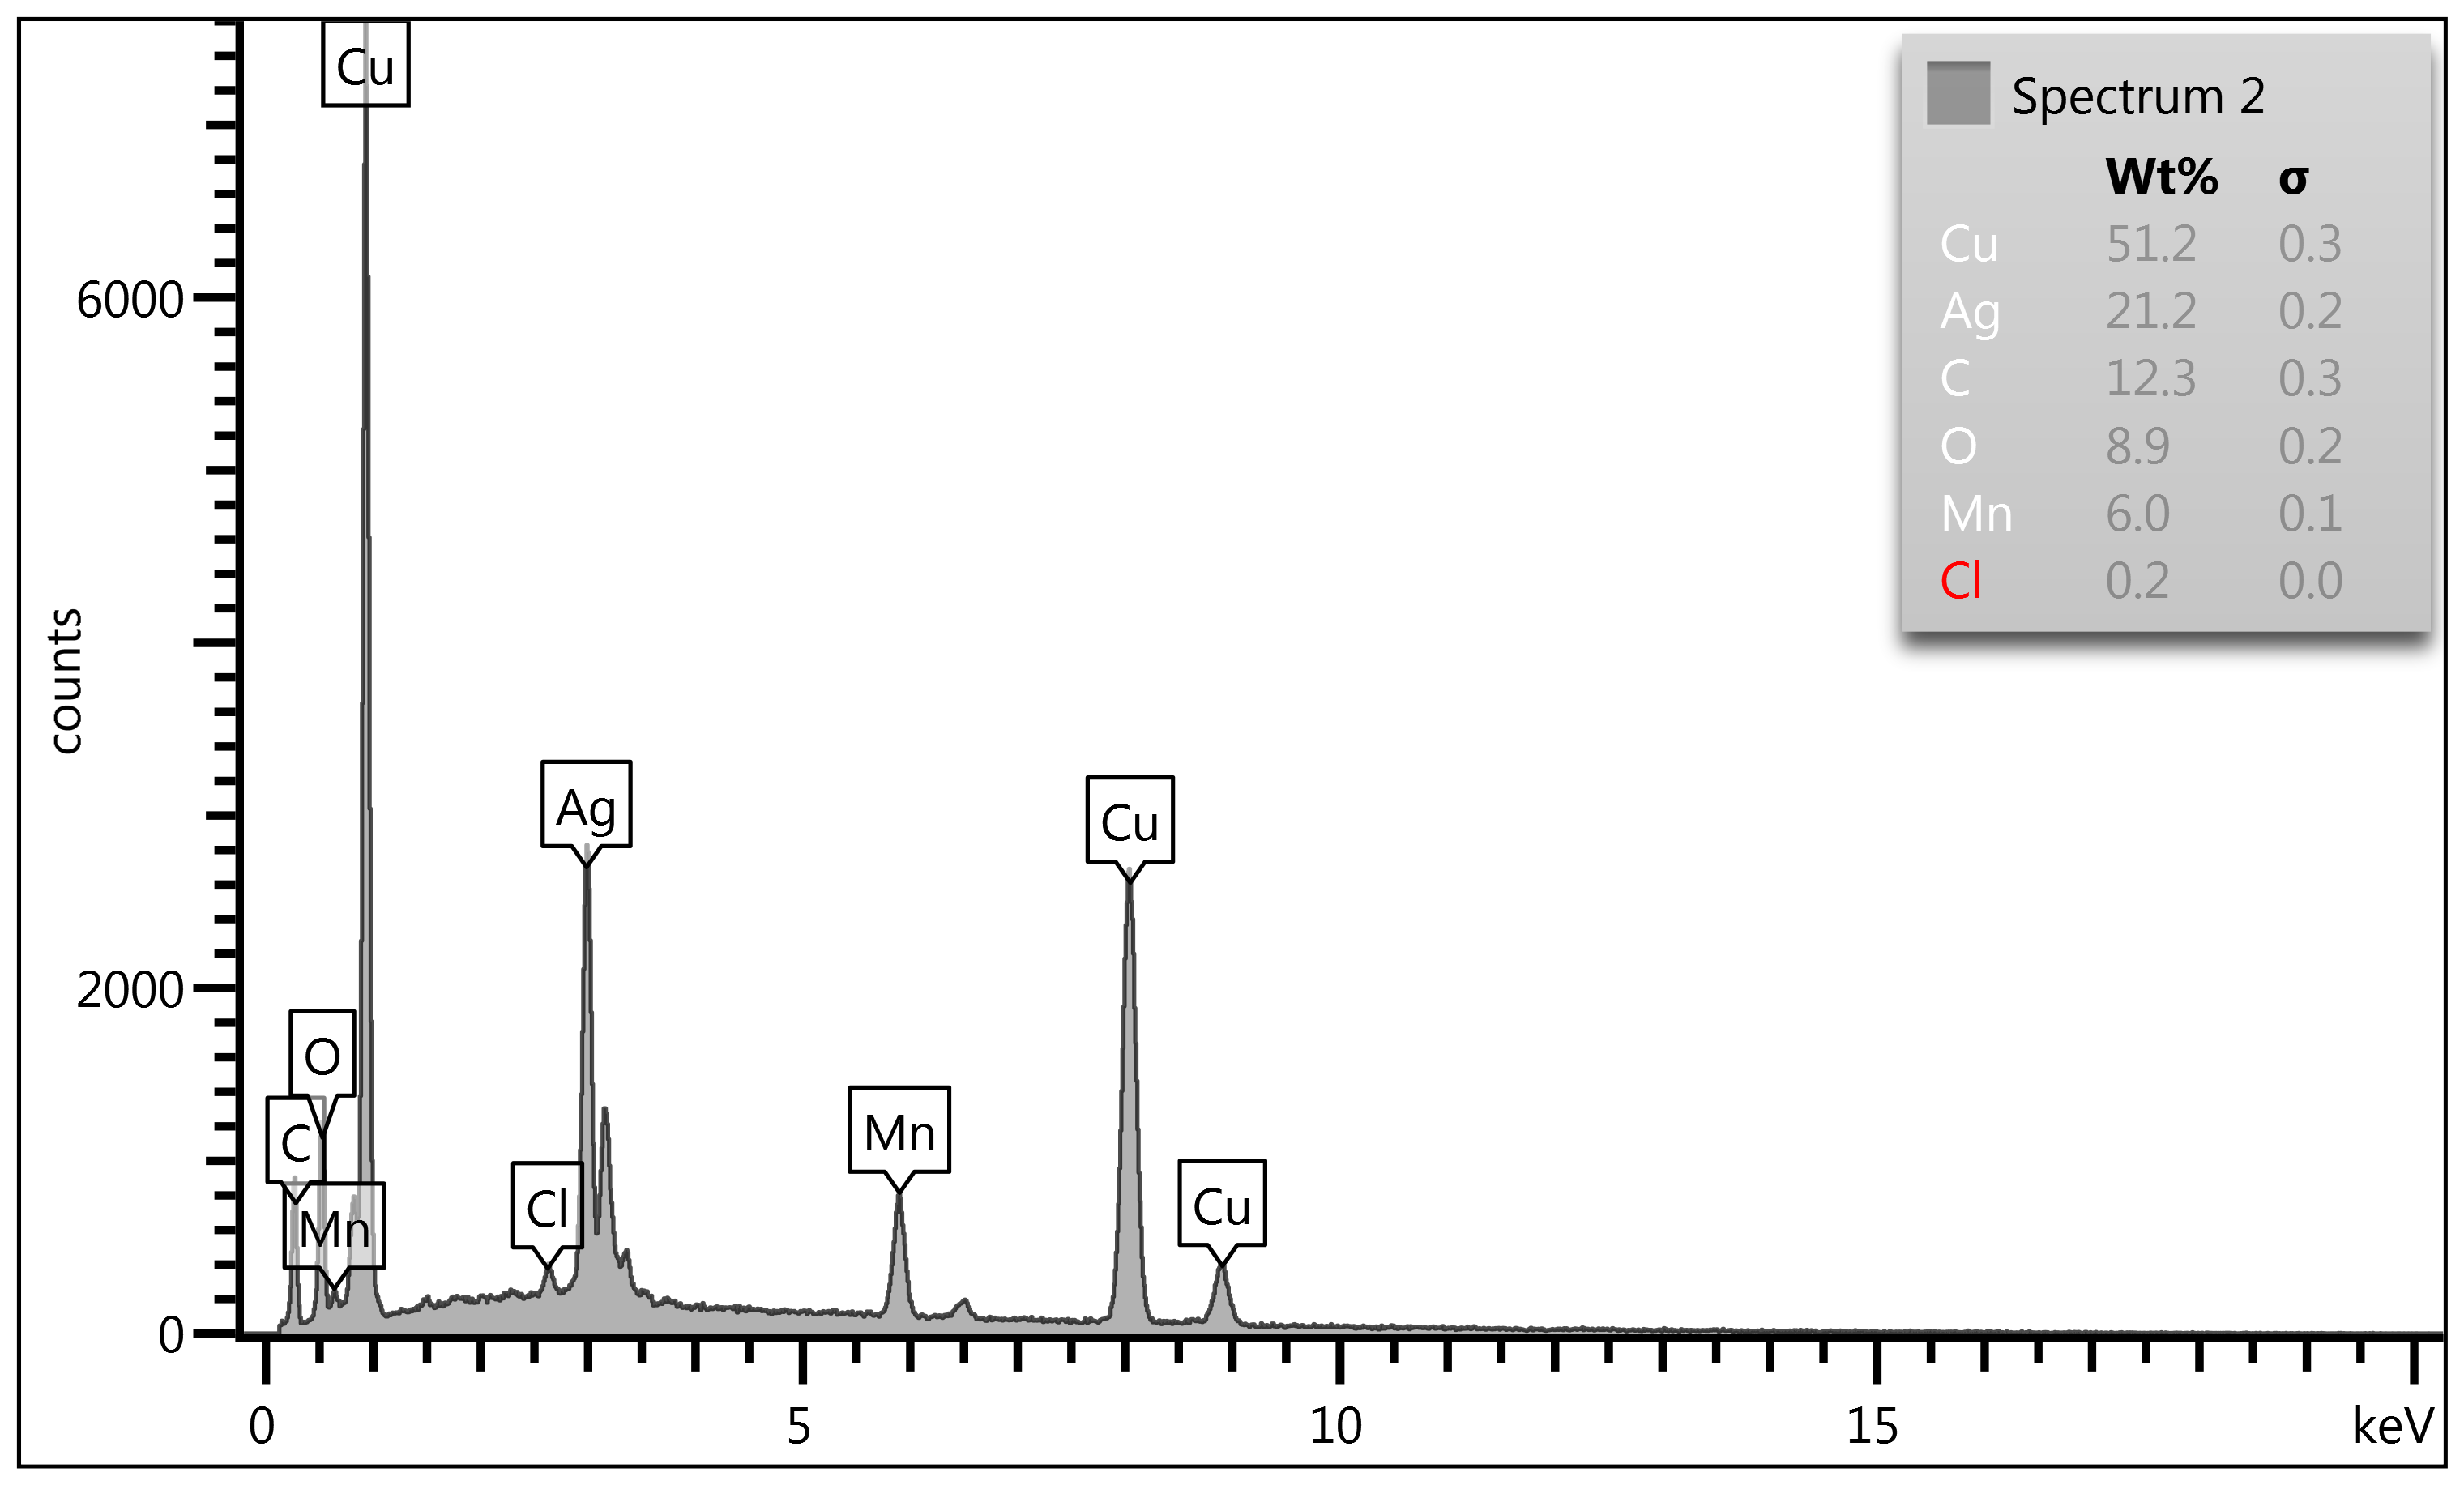
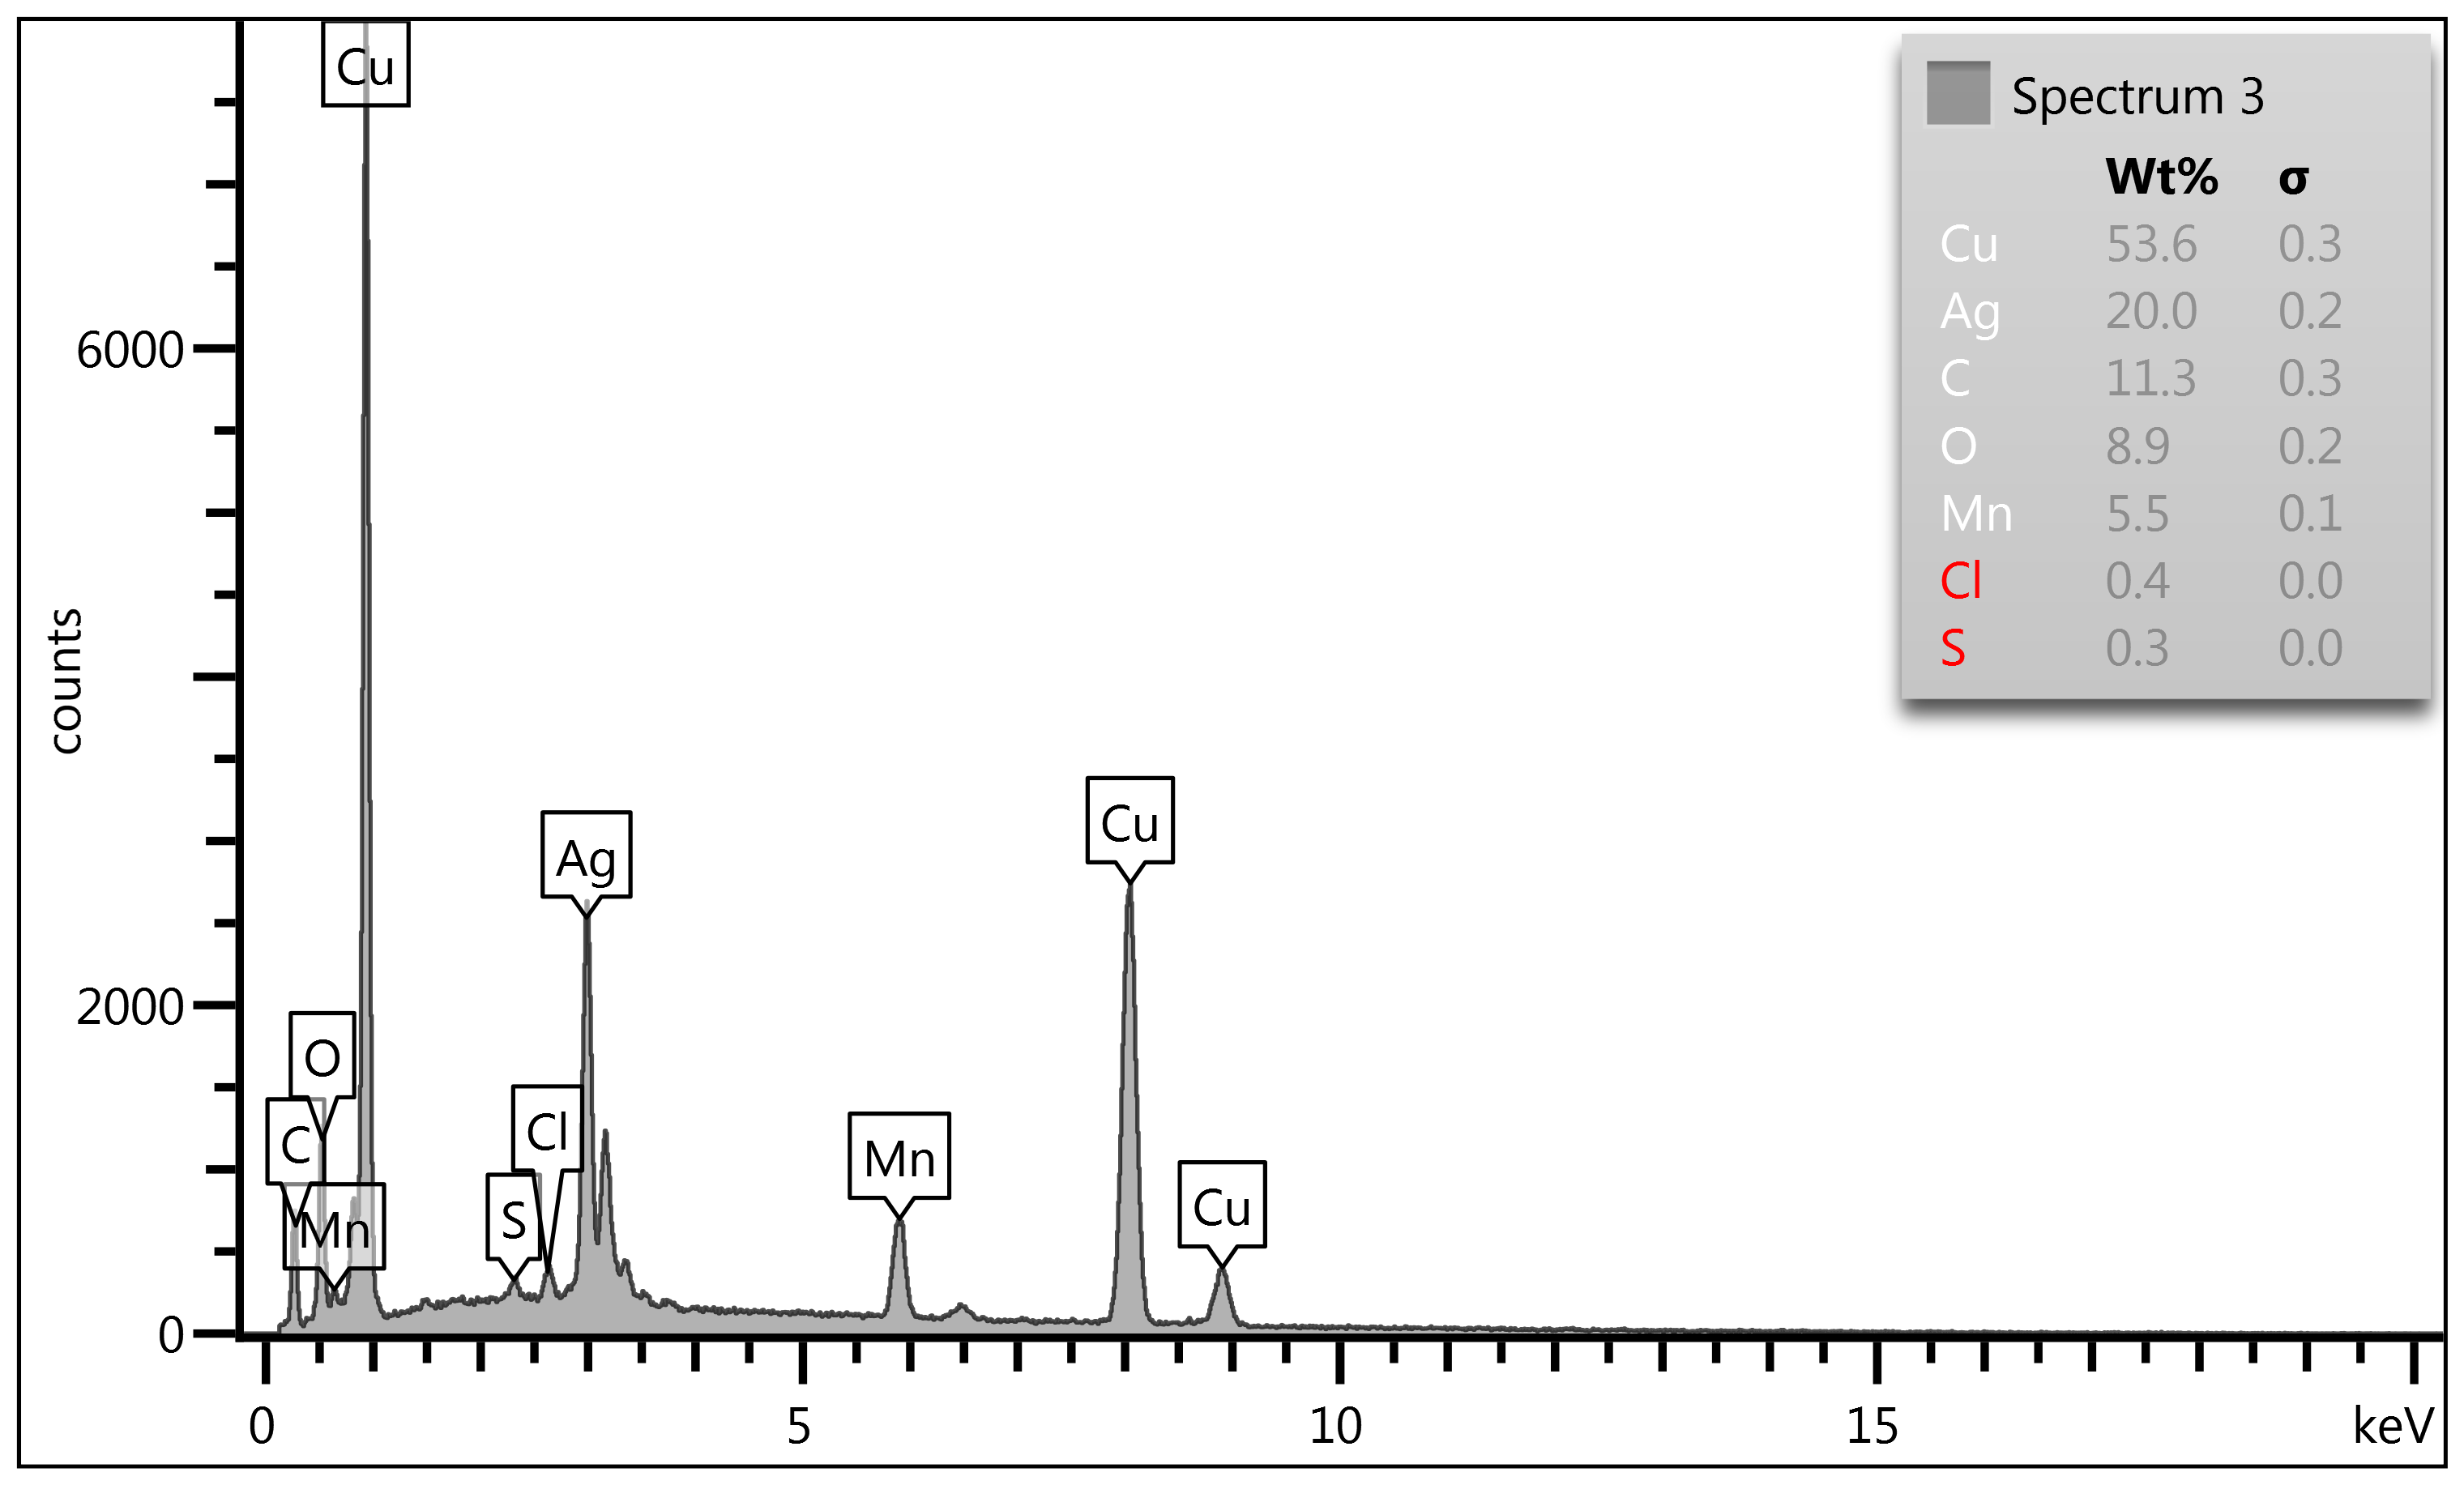
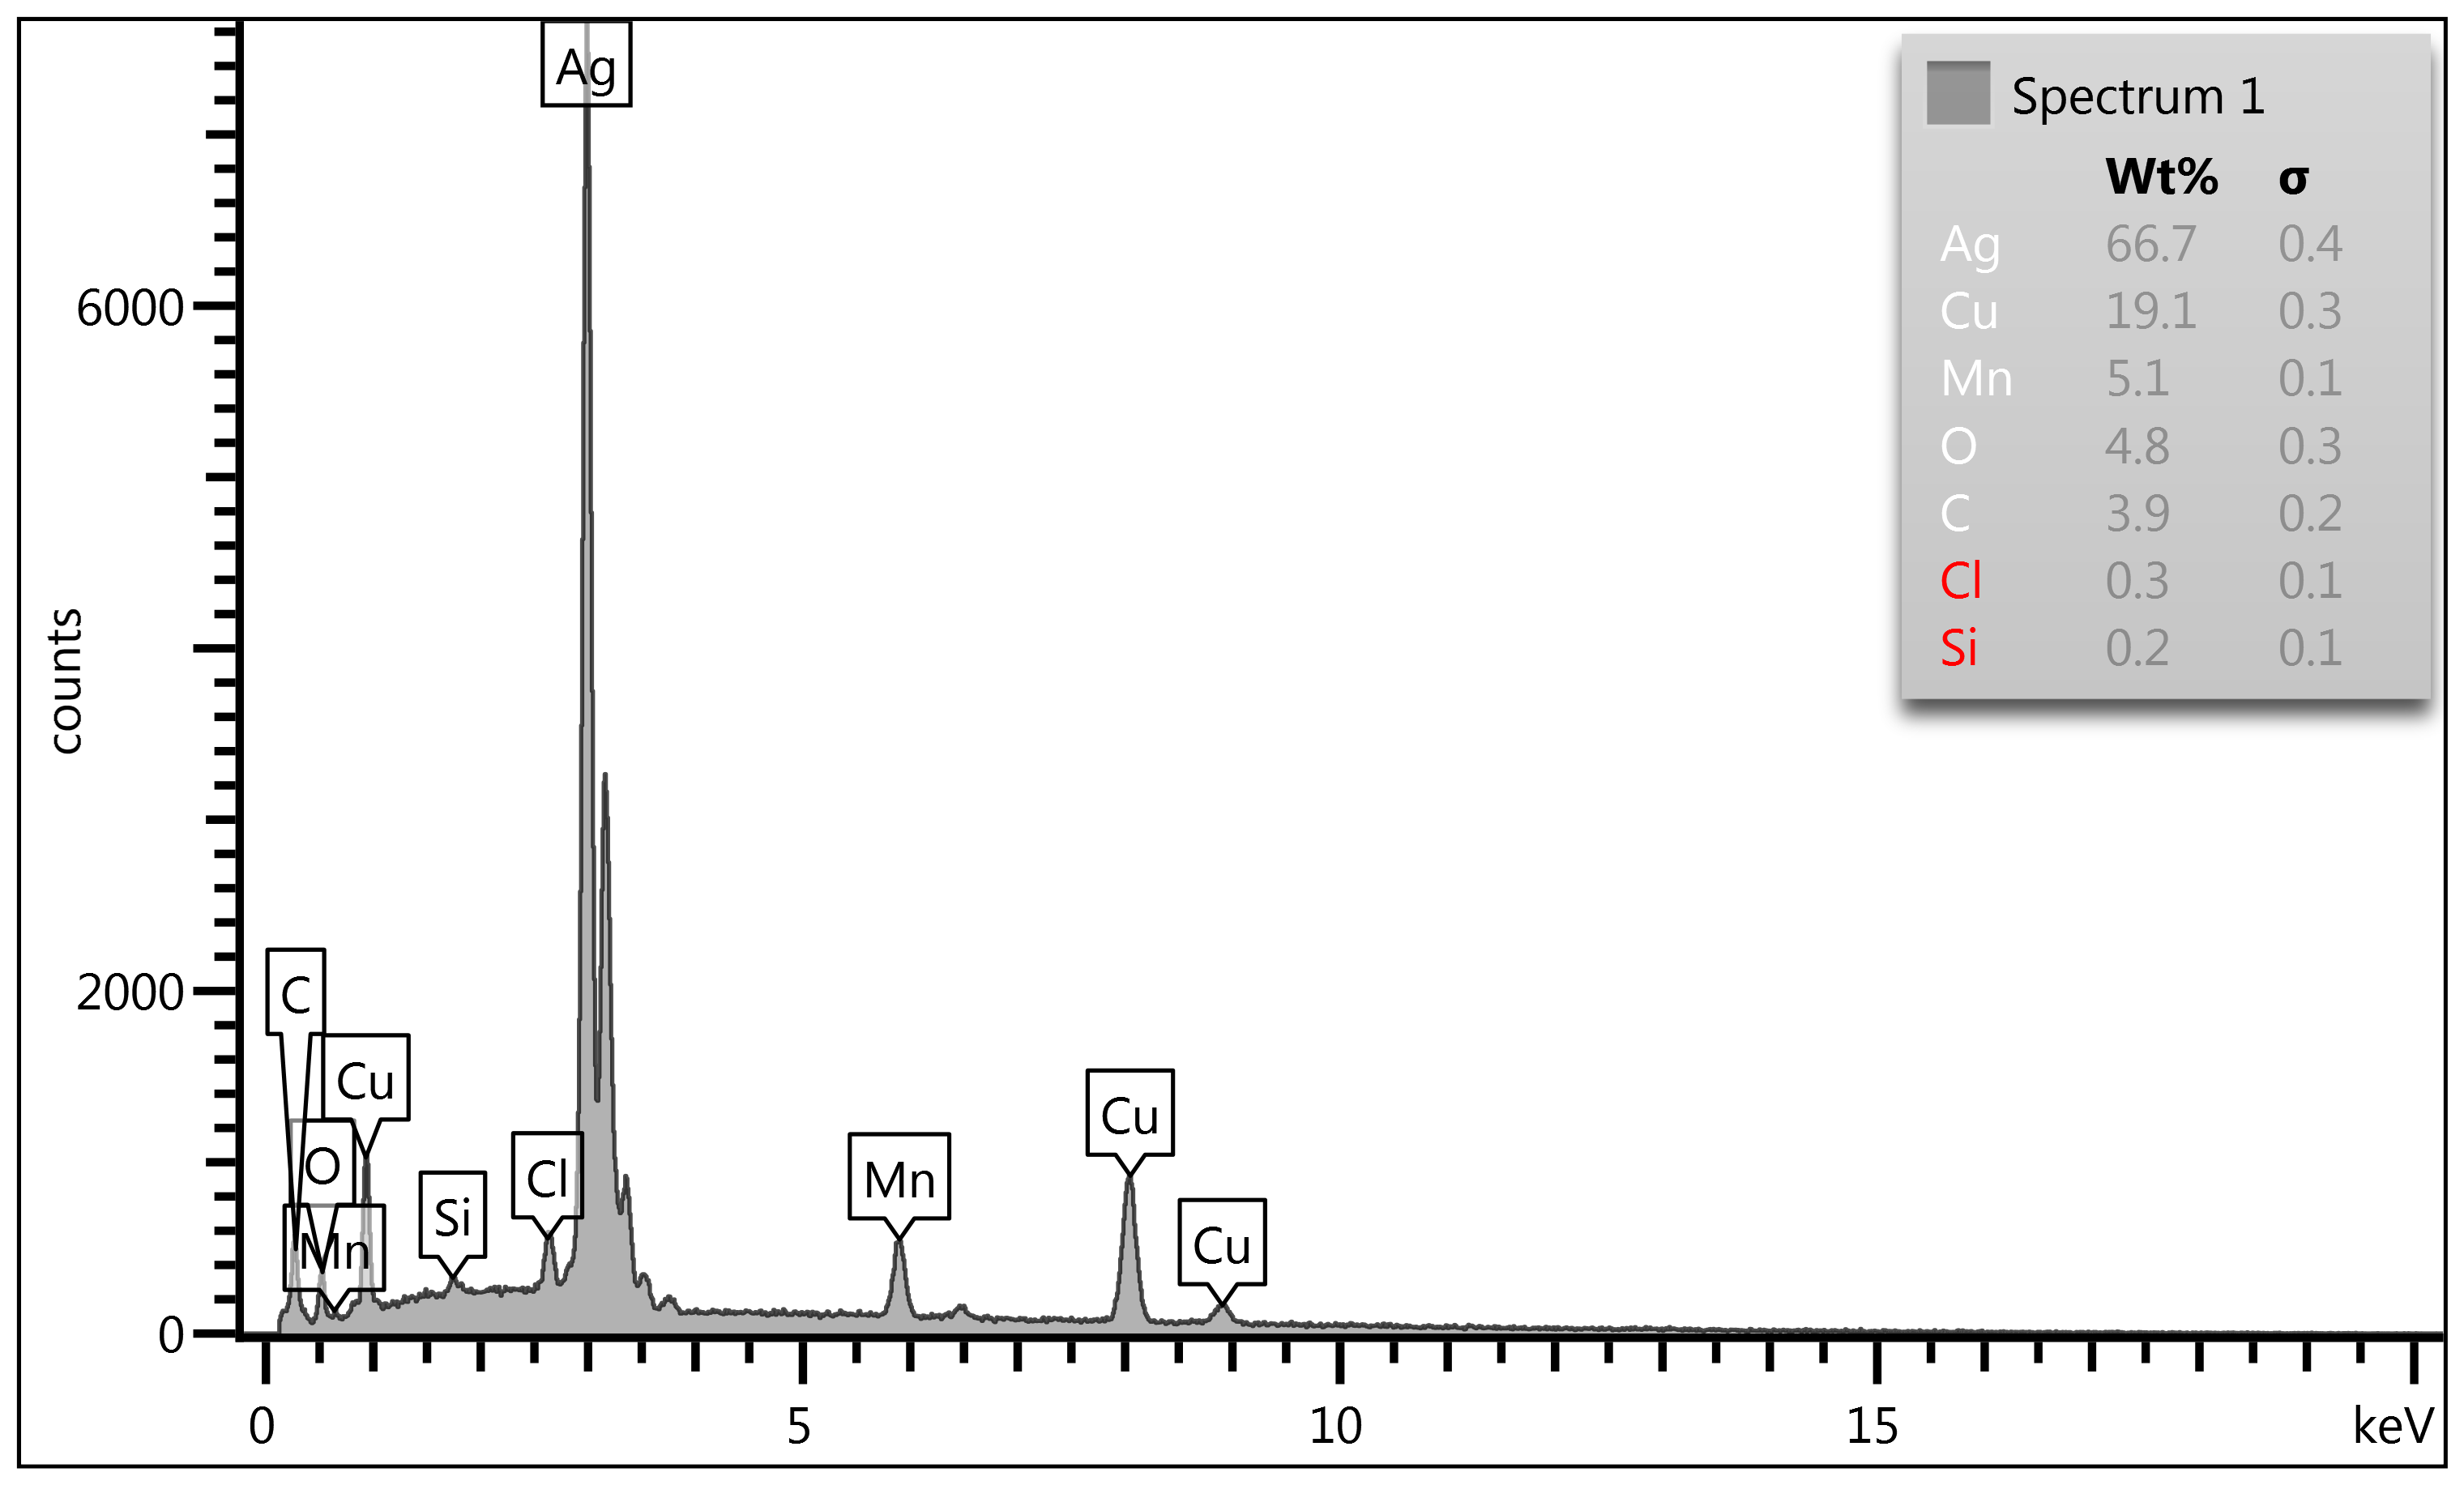
Figure 5-c: 1000X Point & ID Analysis of Coin #2:
In Spectrum #1 we encounter a localized silver enriched area (i.e., note
its bright shade), a poor area of Mn but high enough where we also encounter contaminant
chloride (Cl) levels which when combined with Mn-oxides attribute to the
delamination. In Spectrum #2 we see a copper (Cu) dominant region with Mn high (7.6%
extrapolated from 6.0%) and again chlorine (Cl) is present. In Spectrum #3
showing Mn-oxide chemistry with the three main delamination culprits (Oxygen
-O, Chlorine - Cl & Sulfur - S) together driving the lamination to continue
at the upper surface.
Coin #3 Map Sum Summary
|
Element
|
Line
Type
|
Apparent
Concentration
|
k
Ratio
|
Wt%
|
Wt%
Sigma
|
Standard
Label
|
Factory
Standard
|
|
C
|
K
series
|
2.70
|
0.02703
|
24.33
|
0.34
|
C
Vit
|
Yes
|
|
O
|
K
series
|
2.97
|
0.01000
|
16.45
|
0.28
|
SiO2
|
Yes
|
|
Al
|
K
series
|
0.05
|
0.00035
|
0.21
|
0.04
|
Al2O3
|
Yes
|
|
Si
|
K
series
|
0.17
|
0.00131
|
0.60
|
0.04
|
SiO2
|
Yes
|
|
S
|
K
series
|
0.28
|
0.00243
|
0.81
|
0.04
|
FeS2
|
Yes
|
|
Cl
|
K
series
|
0.38
|
0.00332
|
1.06
|
0.05
|
NaCl
|
Yes
|
|
Mn
|
K
series
|
0.68
|
0.00682
|
2.08
|
0.08
|
Mn
|
Yes
|
|
Cu
|
K
series
|
7.78
|
0.07776
|
23.72
|
0.25
|
Cu
|
Yes
|
|
Ag
|
L
series
|
9.81
|
0.09810
|
30.75
|
0.26
|
Ag
|
Yes
|
|
Total:
|
|
|
|
100.00
|
|
|
|
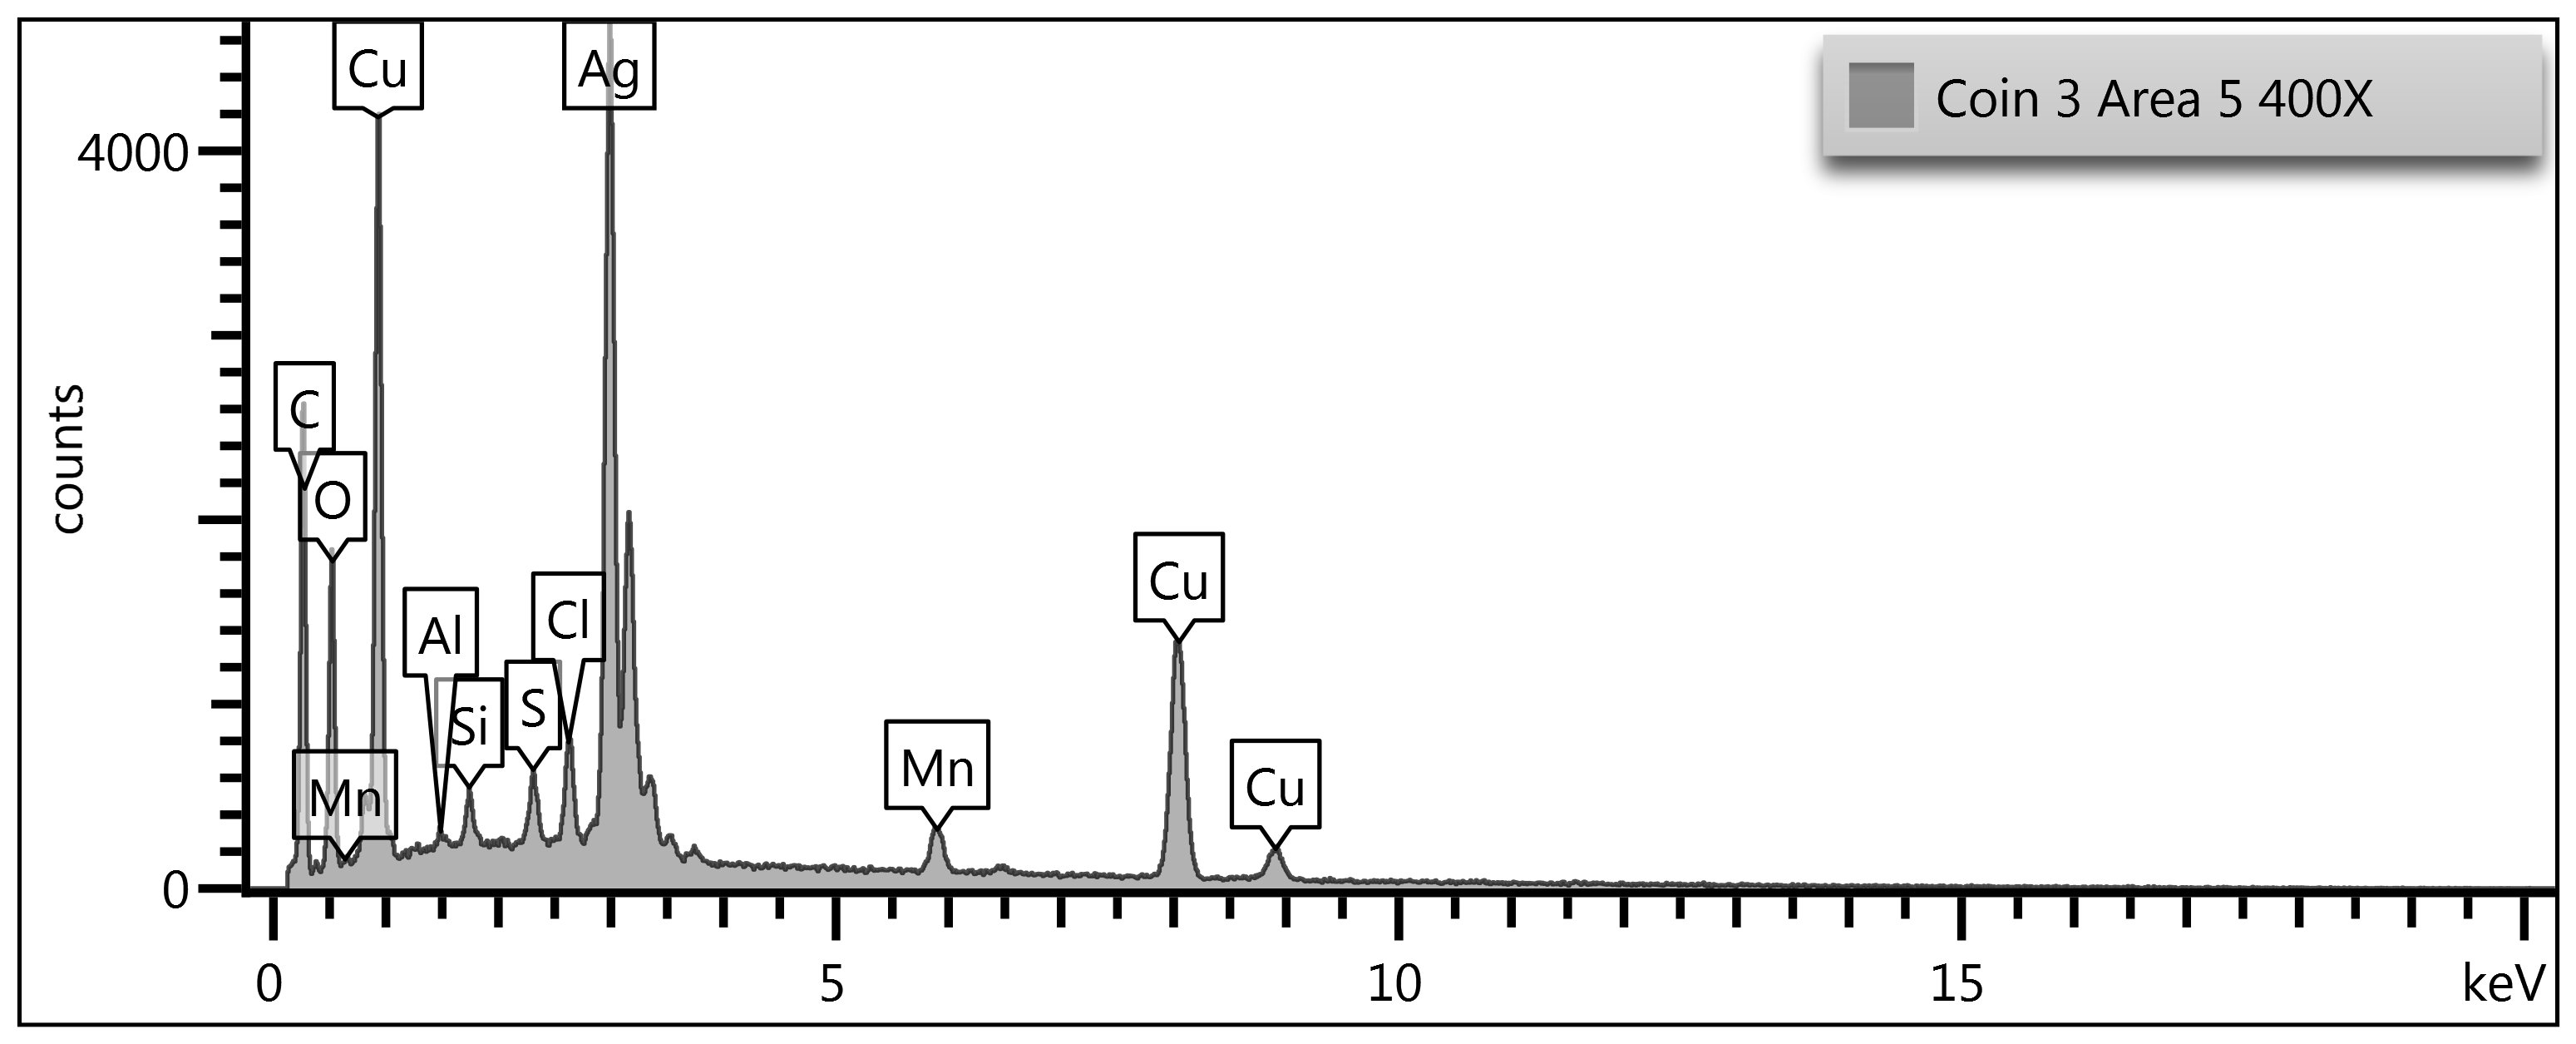
Figure 6-a: Map Sum Summary. Coin #3. Jefferson Nickel.
1943-P 21.12 mm, 4.68 grams. In this Map Sum Summary, we see some
additional surface contaminants with aluminum (Al), Silicon (Si) along with the
usual sulfur and chlorine environmental contaminants. Remembering these coins
were unpolished, which is always a requirement to study the true alloy beneath
the corrosion layer but in this study, this was not our goal with SEM/EDS as
this was done easily with XRF verifying the U.S. Red Book values. What we
wanted here, however, was to study the corrosion layer to see the Mn effects on
the surface. Having said this its best to explain these two contaminants: Silicon
(Si) appears on an unpolished WWII Cu-Ag-Mn nickel surface because it is
one of the most common environmental particulates to bond to oxidized metal.
War nickels develop Mn-oxide and mixed Cu/Ag corrosion films that act like a
chemical "Velcro," trapping airborne dust, soil fines, and silicate debris. Any
coin that has circulated, been stored loosely, or experienced environmental
exposure may accumulate Si-bearing particles on its outer oxide layers. In
SEM/EDS, these particles show up clearly because they sit on top of the
metal rather than within the alloy. Their presence does not indicate
alloy contamination; it reflects surface accretion onto an unpolished, oxide-rich
Mn-segregated coin.
Map Sum Summary - Coin #3 (Continued):
Aluminum (Al) appears for similar reasons, but with
an additional wartime-era twist. Aluminum was ubiquitous in 1940s industrial
environments-machinery dust, airborne shop particulates, and household abrasion
all contributed Al-bearing debris that readily adheres to oxidized metal. On a
war nickel, Mn-oxide networks create high-energy surface sites that trap Al-oxide
particles, especially in micro-cracks and delaminated regions. Because the coin
is unpolished, these adhered particles remain intact and are easily detected by
SEM/EDS. Like Si, Al is not part of the Mint alloy; it is a surface contaminant
bonded to Mn-rich corrosion films.
Microstructure - Coin #3
Figure 6-b Microstructure of Coin #3: Jefferson Nickel.
1943-P 21.12 mm, 4.68 grams. Coin #3 shows the same surface behavior and
microstructural signature as Coin #2: a Cu/Ag matrix that has been chemically
and mechanically disrupted by long-term manganese segregation and oxide
formation. The SEM field displays the familiar granular deformation bands, dark
Mn-oxide stringers, and scattered particulate debris trapped in surface cracks.
These Mn-rich zones fracture and lift, exposing brighter Ag-rich subsurface
metal and creating the uneven, cratered appearance characteristic of aged war-nickel
alloy. Nothing in the morphology suggests casting or counterfeit behavior;
instead, Coin #3 reflects the same Mn-driven corrosion pathways, oxide
delamination, and environmental particle adhesion seen in Coin #2, confirming a
shared metallurgical and surface-evolution pattern.
Point & ID Analysis - Coin #3
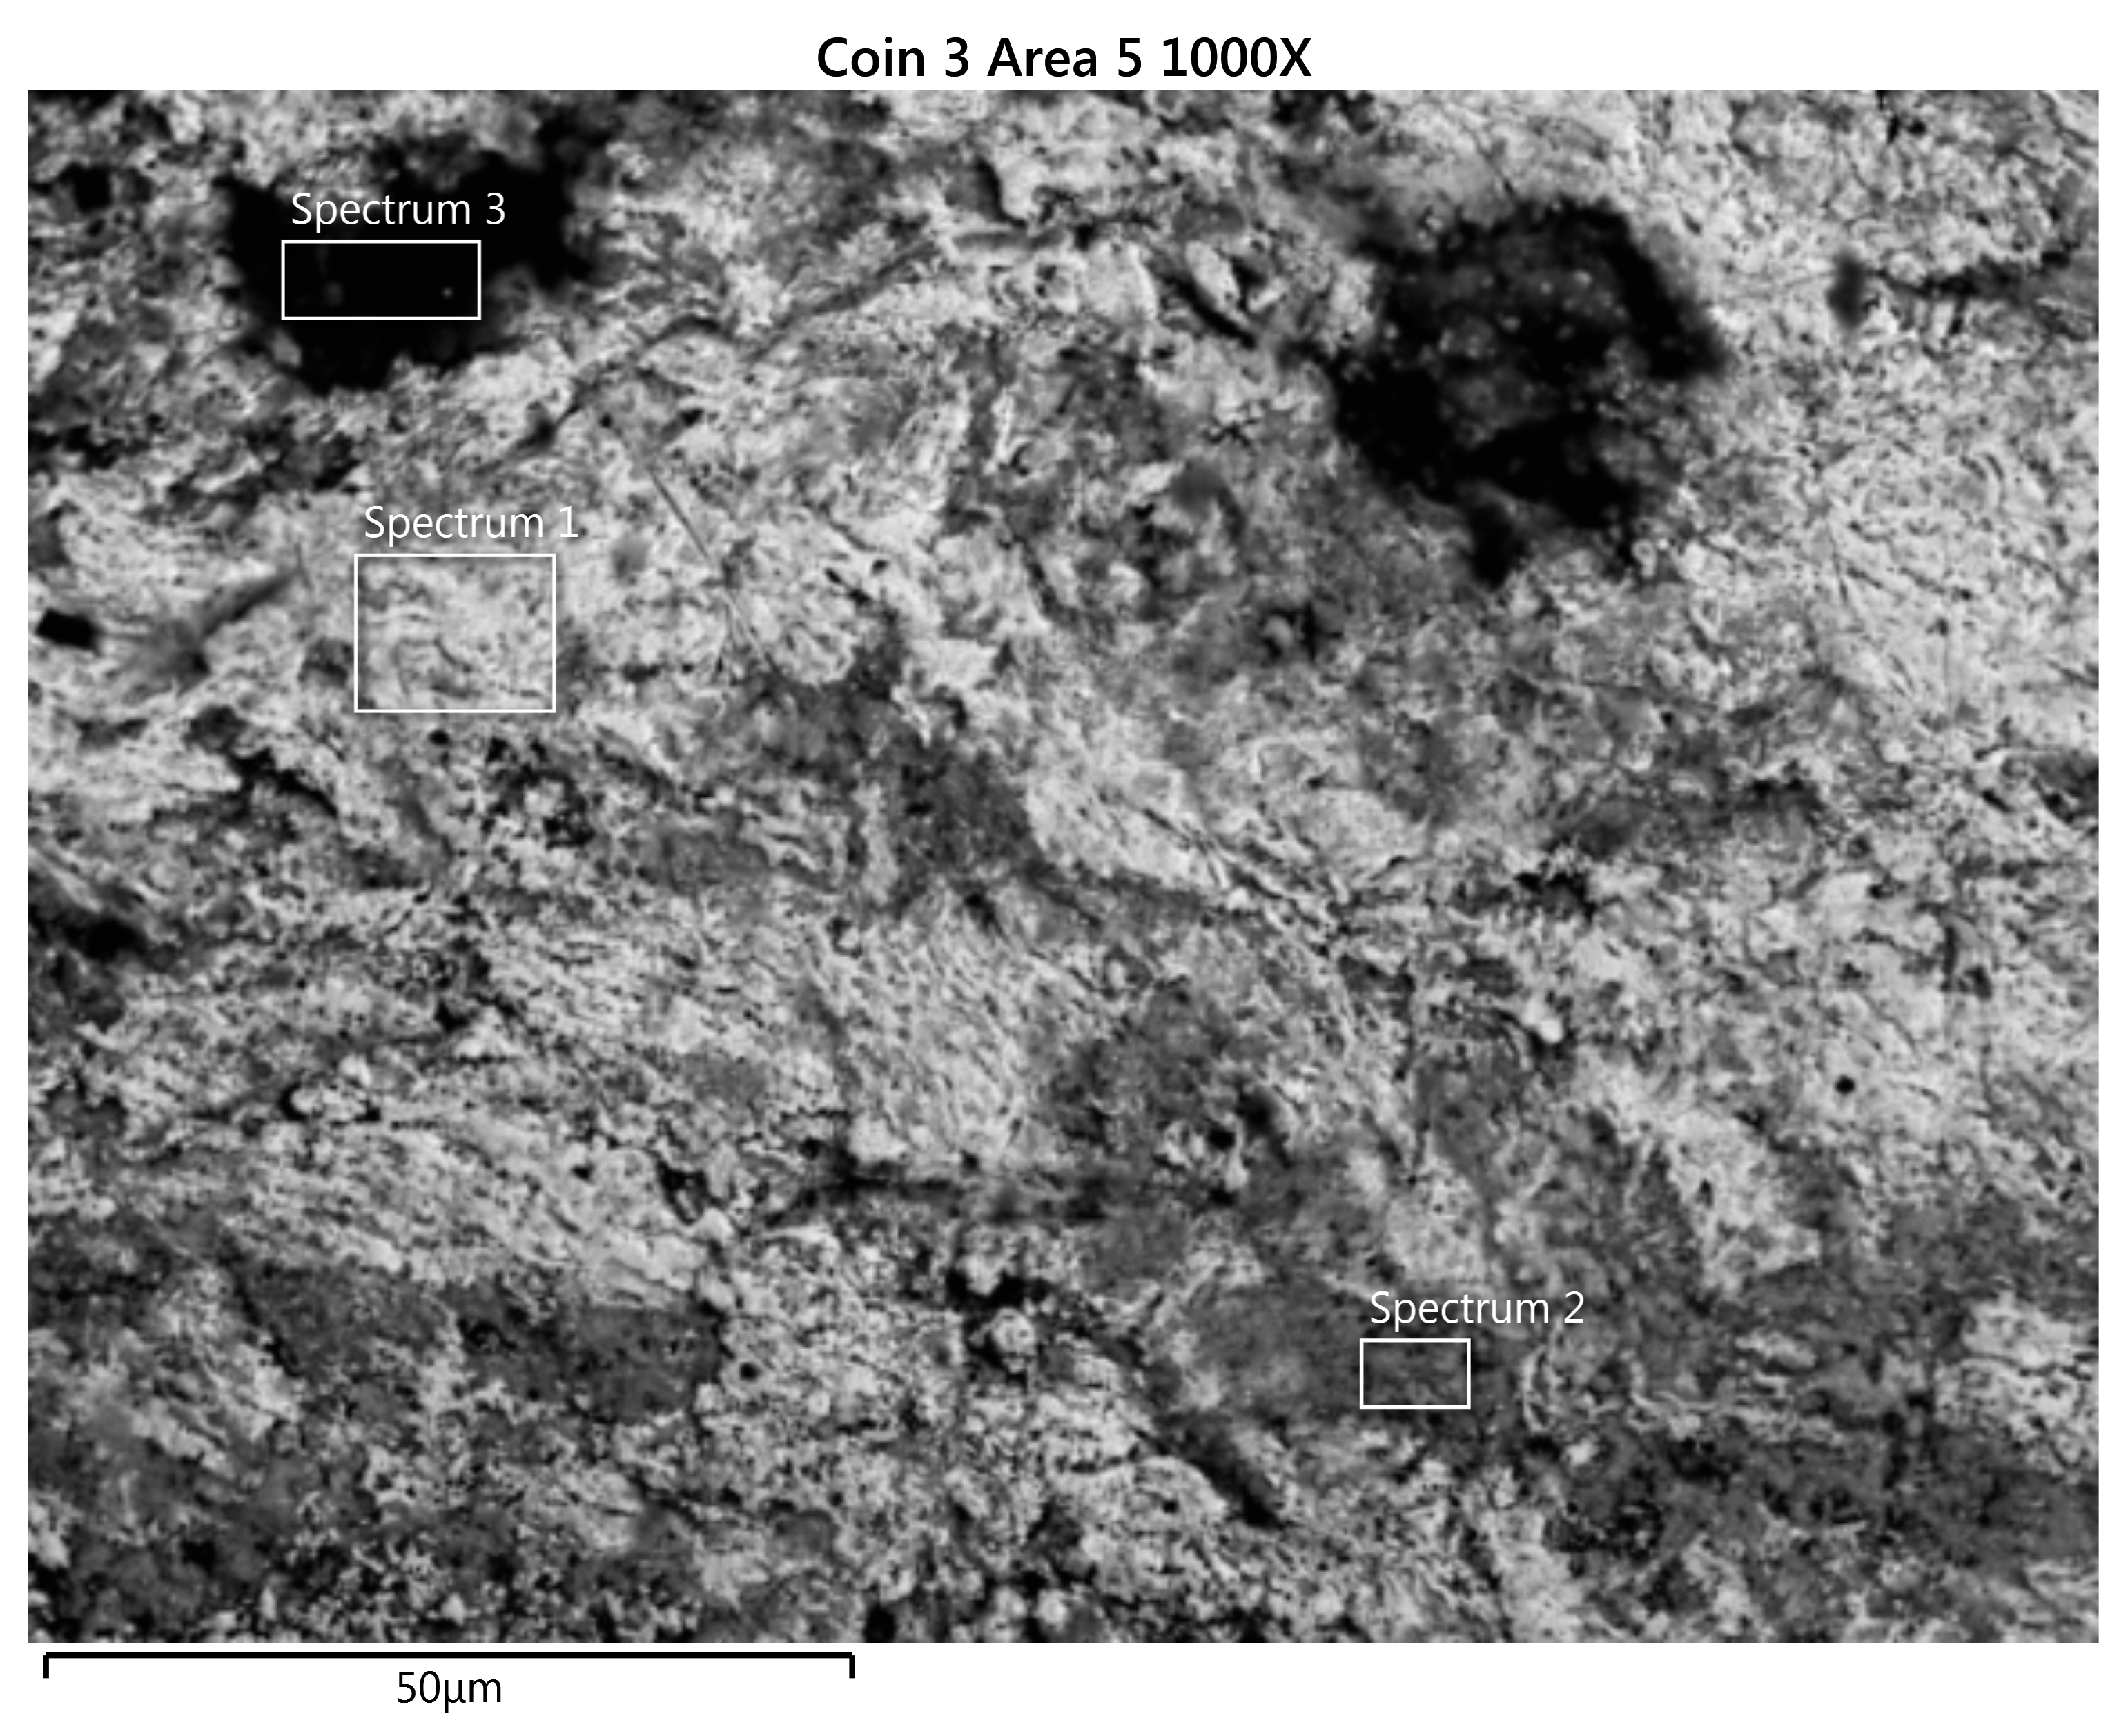
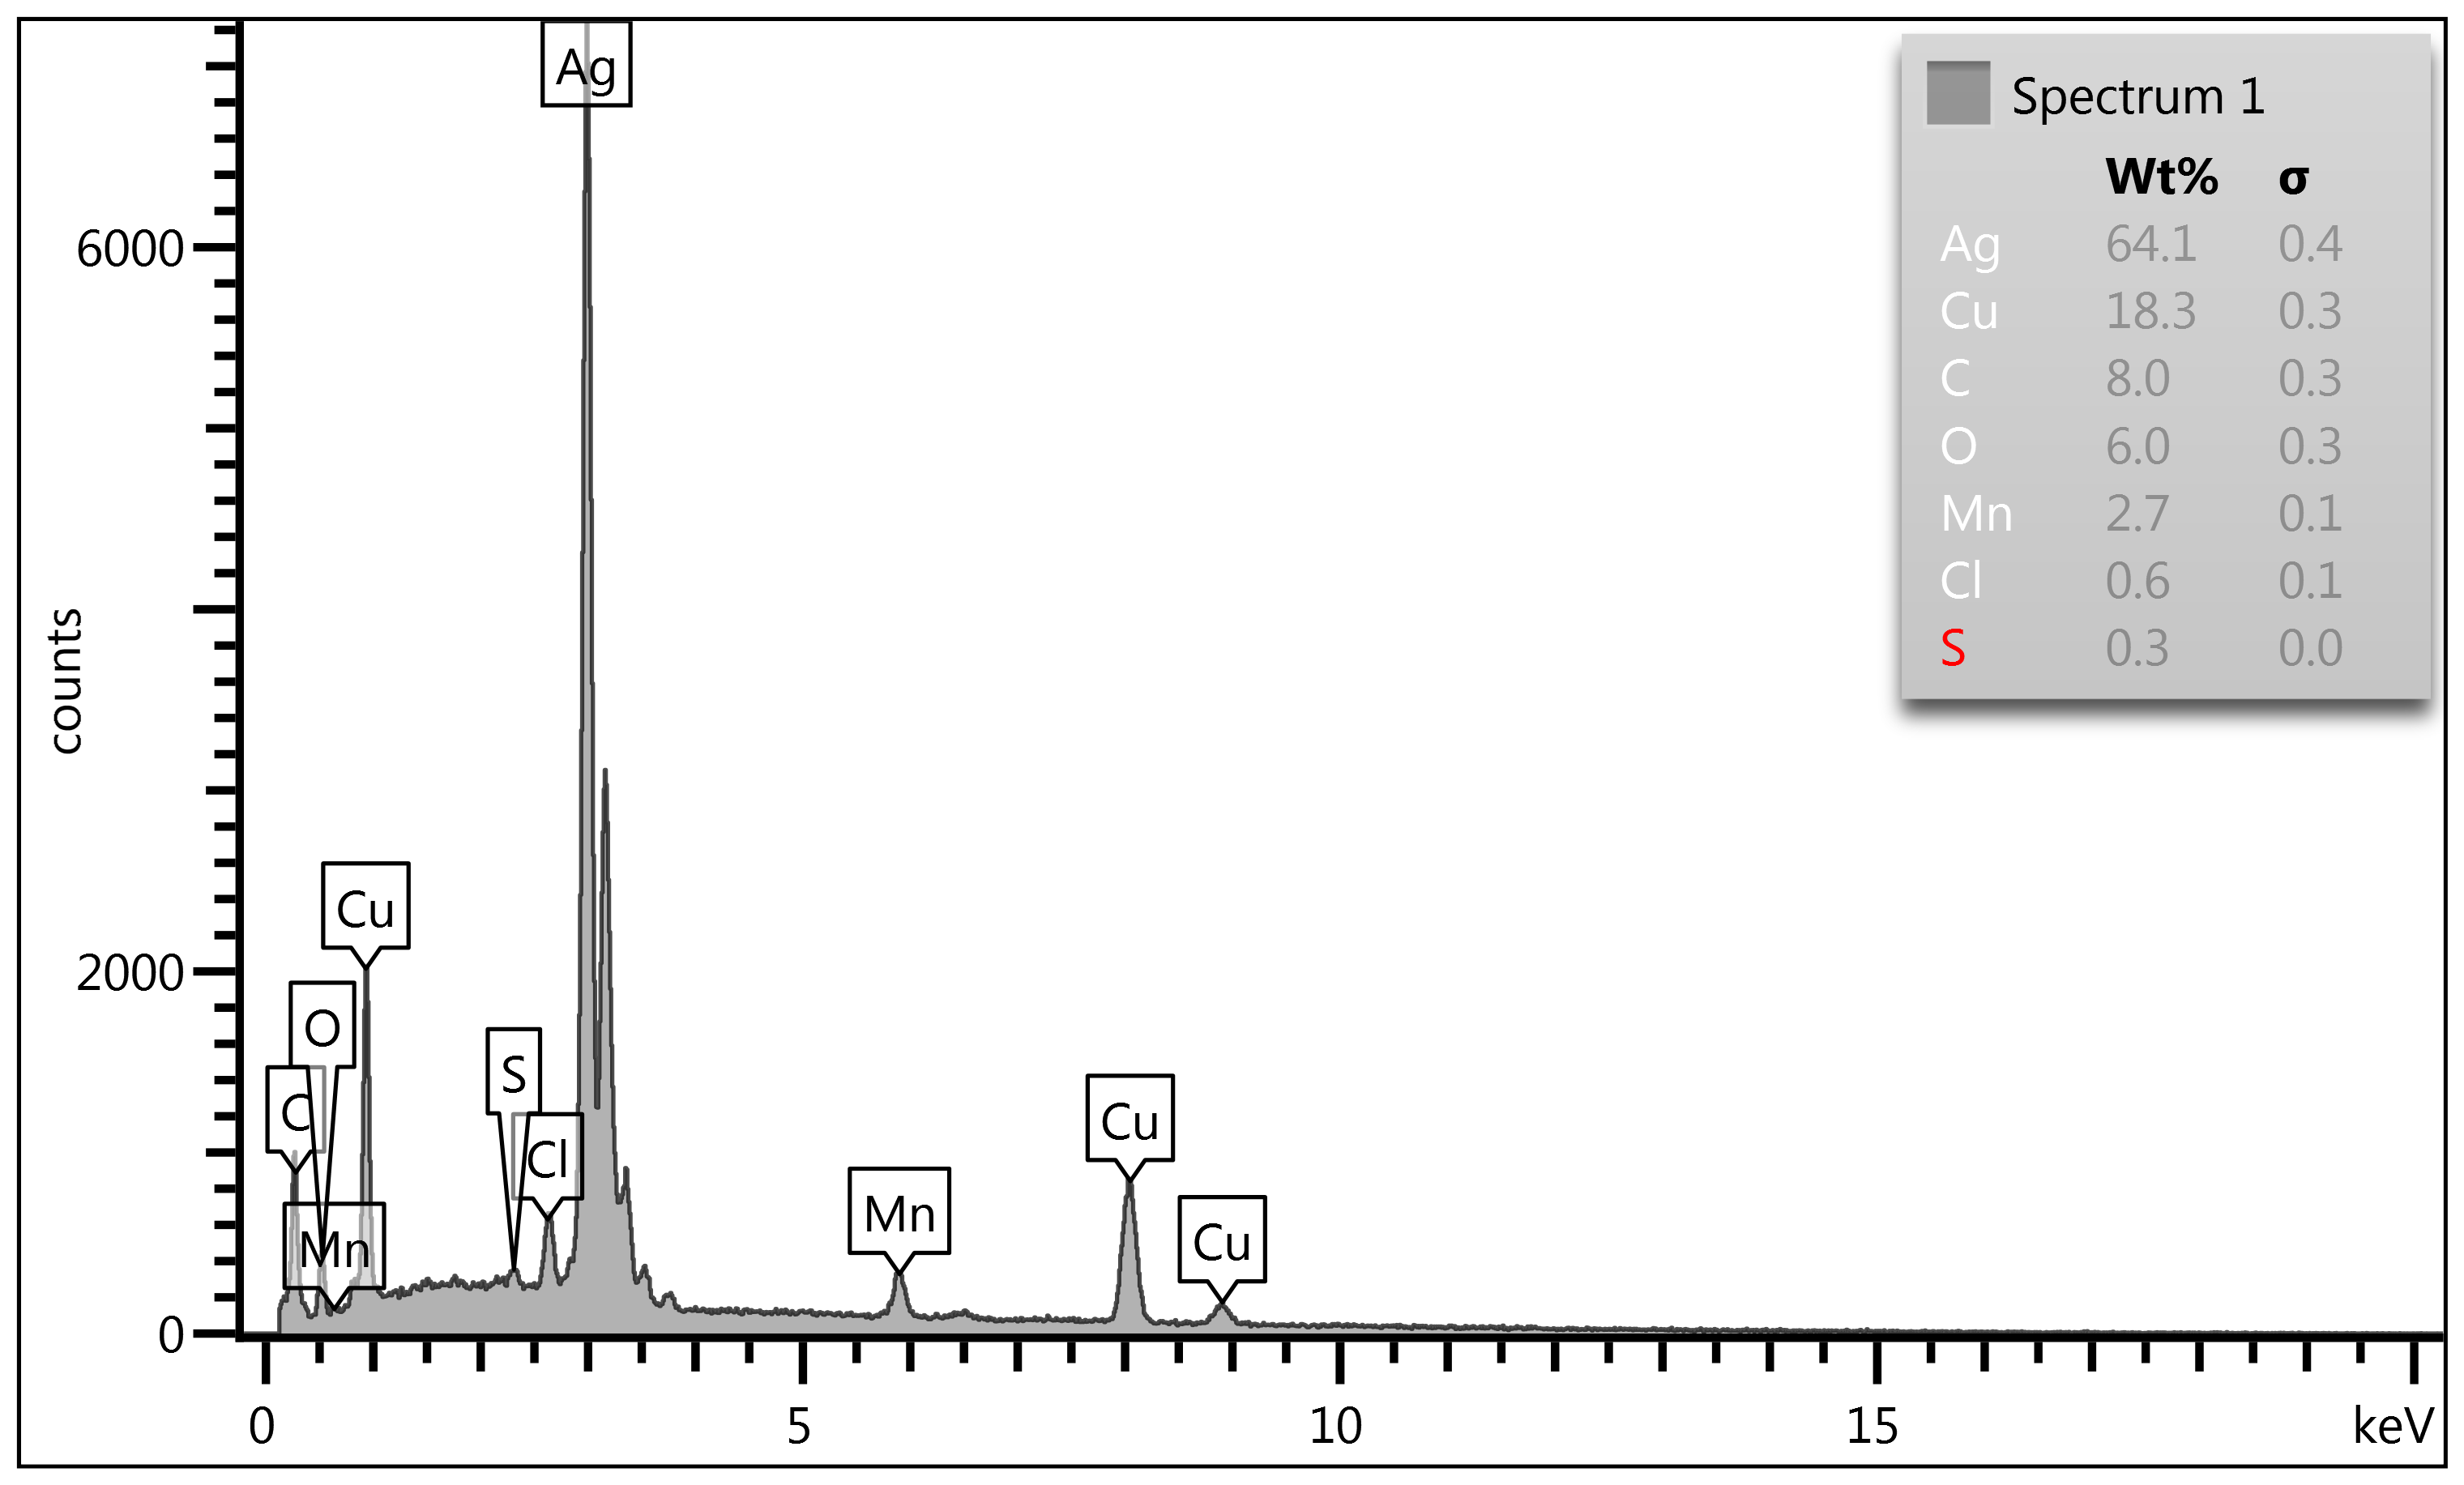
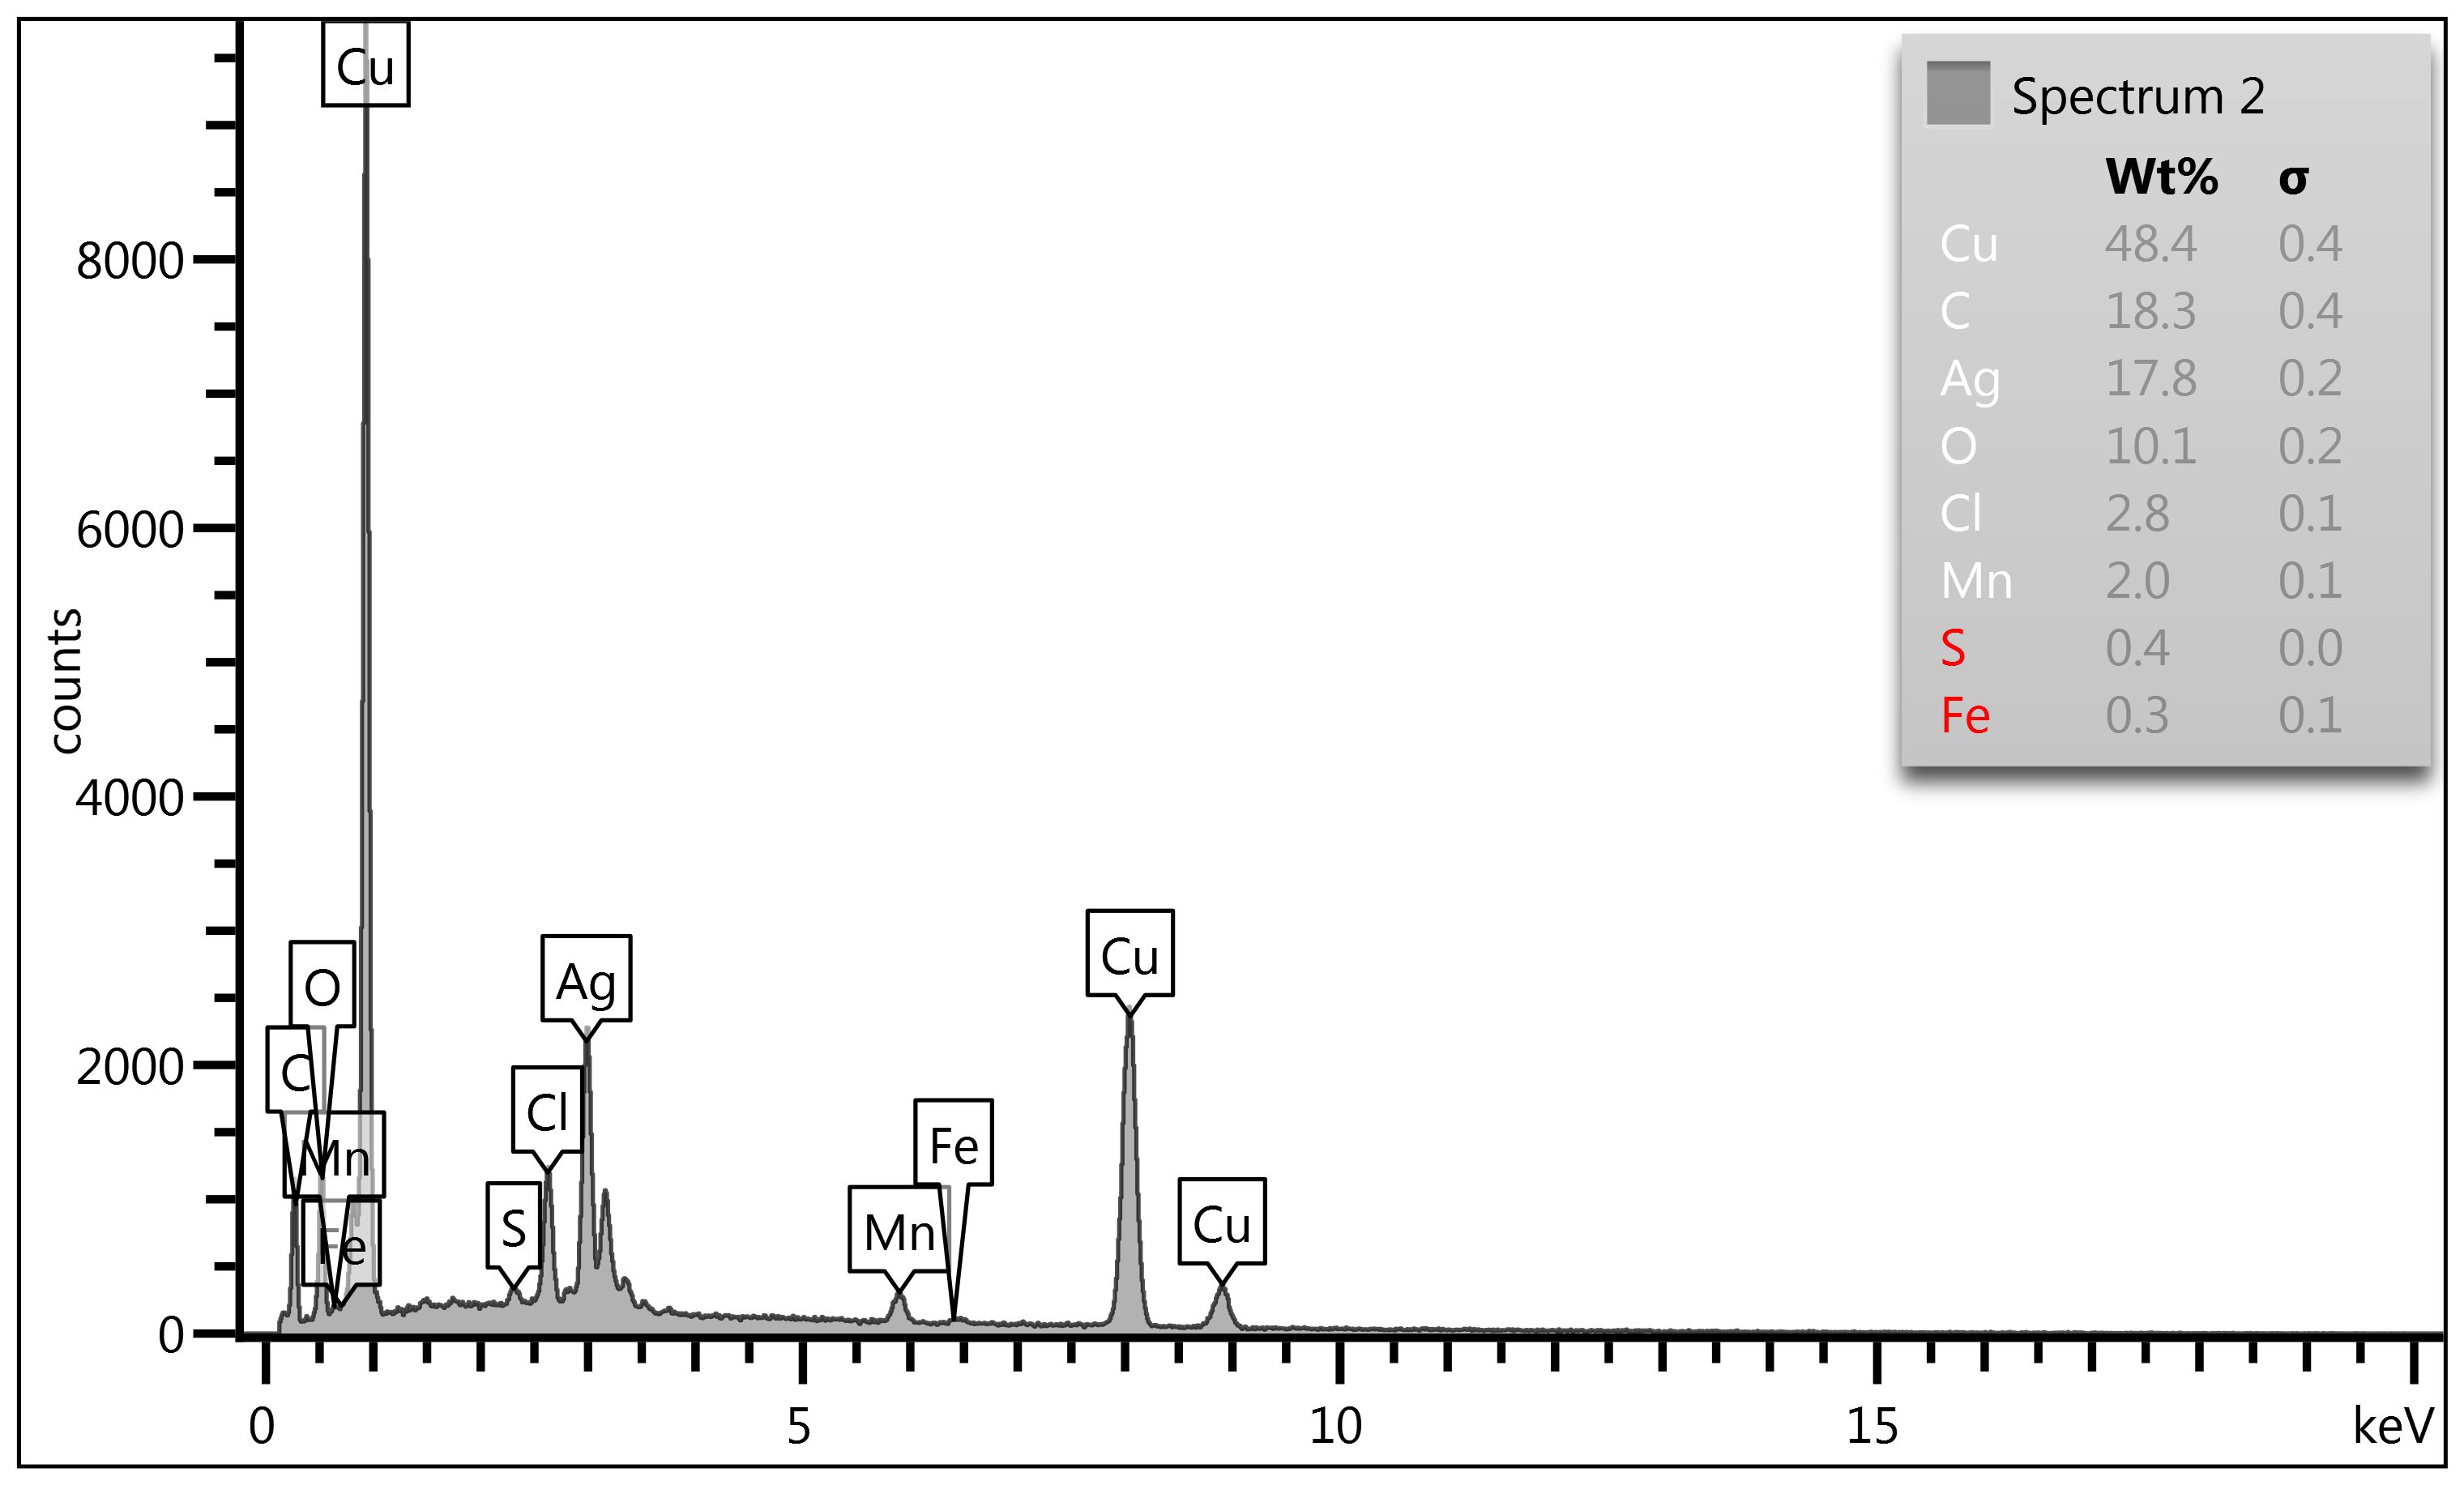
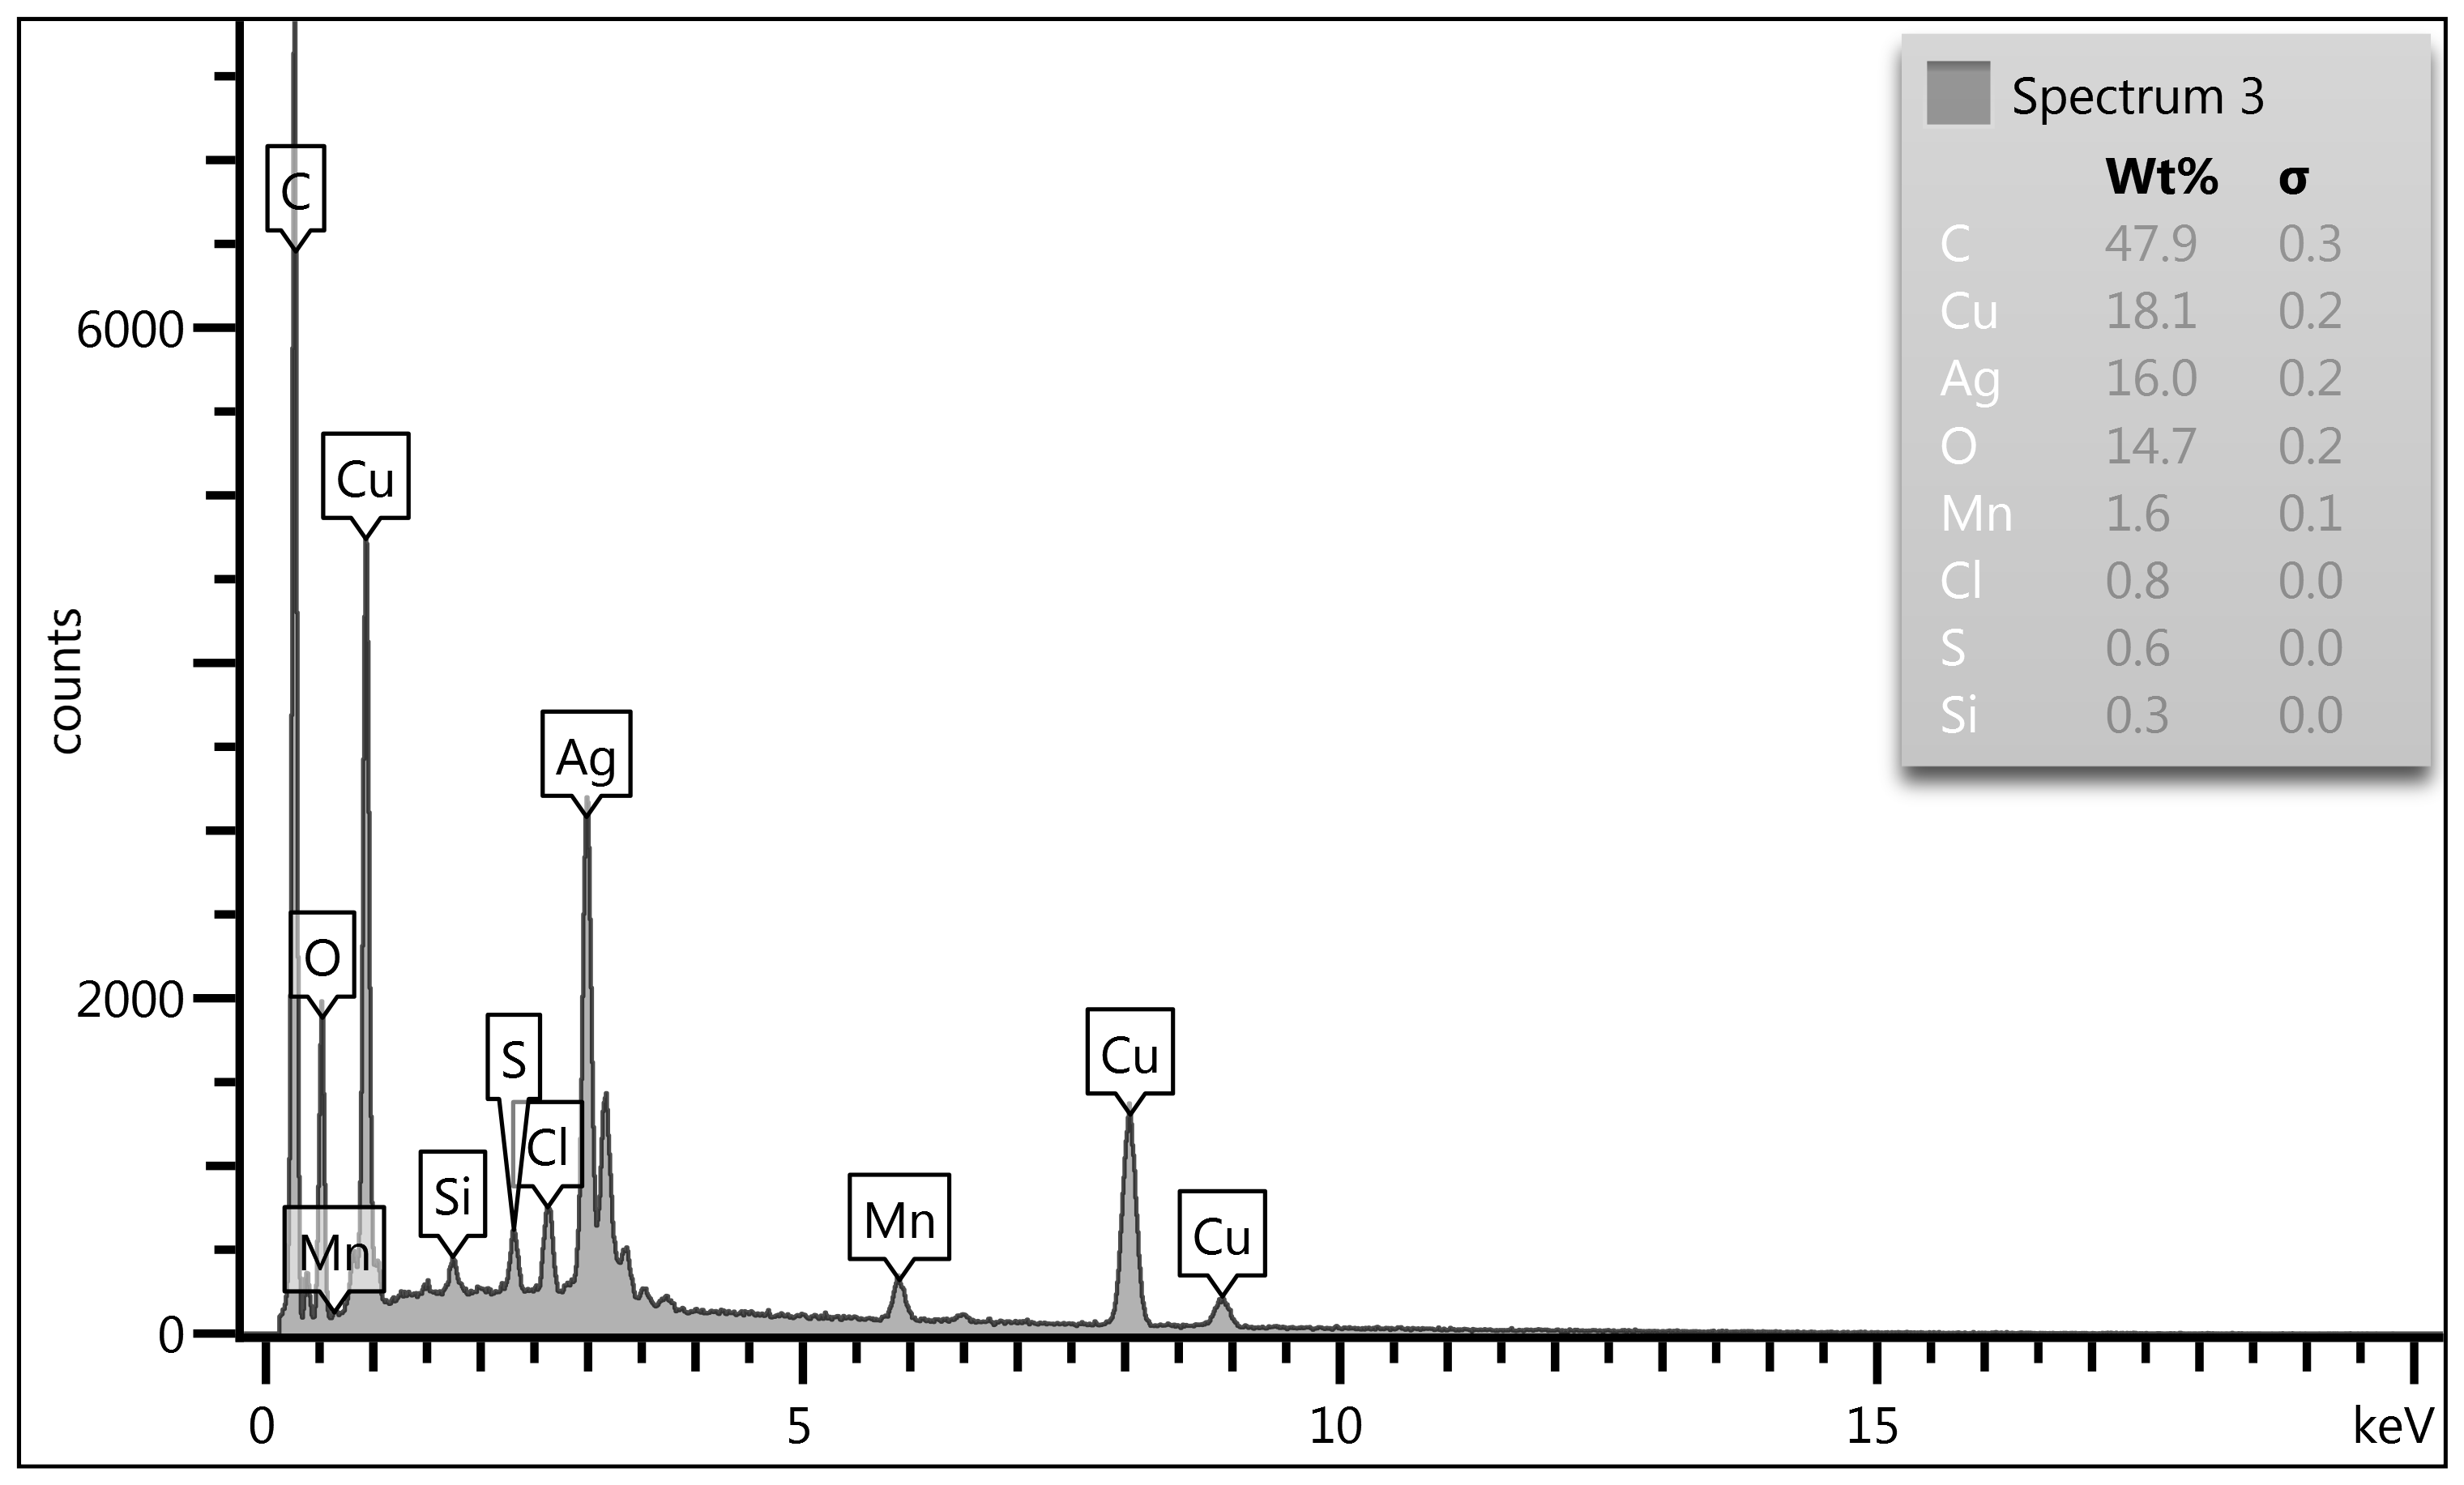
Figure 6-c: 1000X Point & ID Analysis of Coin #3: In
Spectrum #1 we see a silver enriched area or part of the microstructure matrix
having high silver, in Spectrum #2 we then encounter a copper-rich area with
iron contamination. Trace iron on an unpolished WWII Cu-Ag-Mn nickel
surface is completely expected and comes from two natural sources tied to 1940s
Mint metallurgy. First, iron is a common impurity in both copper and silver
feedstock, especially during wartime when the Mint relied heavily on
recycled industrial metal. Copper scrap frequently contained Fe from electrical
hardware, plating residues, and mixed-metal recovery streams, while silver
bullion often carried trace Fe from ore-origin mineral associations such as
pyrite and other iron sulfides. Even after refining, ppm-level iron routinely
remained in the final melt. Second, Fe can appear from Mint equipment
contact-dies, planchet-handling machinery, and steel tooling shed
microscopic iron particles that embed into the coin's oxide layer.
Figure 6-c: 1000X Point & ID Analysis of Coin #3:
Continued:
Once the Cu/Ag/Mn matrix begins its long-term Mn-oxide
segregation and surface cracking, these Fe particles become trapped, enriched,
and easily detected by SEM/EDS. So, the iron we are seeing is a combination of scrap-origin
impurity and equipment-derived micro-transfer, exposed and concentrated by
the same Mn-driven surface evolution that defines war-nickel corrosion. In
Spectrum #3 the Matrix shows equal amounts of Cu & Ag with outside
contaminates of chlorine, silicon and sulfur (Cl, Si & S).
Overall assessment of Coin #3
Coin #3
shows the classic metallurgy of a 1943 WWII Jefferson nickel, where long-term
surface evolution is driven by the Cu-Ag-Mn alloy's inherent instability. The
SEM fields you've provided show a wrought, mechanically struck matrix with
granular deformation bands, fractured oxide sheets, and void-linked channels-features
that arise because manganese does not remain uniformly dissolved in the Cu/Ag
matrix. Instead, Mn segregates during solidification, later migrates toward the
surface, and forms brittle Mn-oxide networks that crack, lift, and expose
underlying metal. This is why the surface appears uneven, cratered, and
fibrous: you're seeing decades of Mn-driven corrosion and delamination rather
than mechanical wear.
The Point & ID data reinforce this metallurgical
behavior. Mn-rich zones appear as darker, fractured regions, while Ag-rich
subsurface metal becomes visible where Mn-oxide sheets have detached. Cu is
depleted at the surface because Mn-oxide formation disrupts the Cu matrix and
accelerates localized corrosion. Environmental particulates-Si, Al, Fe-become
trapped in these high-energy oxide networks, further contributing to the
heterogeneous appearance. Nothing in the microstructure suggests casting or
counterfeit production; everything aligns with genuine wartime Mint alloying
and the predictable long-term chemistry of Cu-Ag-Mn.
Together, the Map Summary, SEM morphology, and Point &
ID spectra show a coin whose surface has evolved exactly as expected for a WWII
nickel: Mn separates from the matrix, oxidizes, reacts with contaminants,
fractures, and ultimately delaminates the outer layer. Coin #3 matches Coin #2 in every metallurgical
respect, confirming a shared alloy behavior and identical corrosion pathway.
Some questions to consider when comparing XRF data and
SEM/EDS data:
1.
Why does the XRF alloy assay data mimic the U.S. Red Book alloy
composition so well and SEM/EDS assay data is all over the place?
Answer: XRF and SEM/EDS behave differently because they are
measuring two very different things, and once you understand the physics
behind each instrument, the contrast makes perfect sense.
XRF reads bulk alloy composition. Its photons
penetrate deeply-tens of microns-sampling a large volume of metal beneath the
surface. That means XRF "sees" the original Mint alloy, not the corrosion, not
the oxides, not the surface debris. So, for a WWII Cu-Ag-Mn nickel, XRF
naturally returns values close to the Red Book composition (Cu 56%, Ag
35%, Mn 9%), because the underlying metal is still the original wartime alloy.
Even if the surface is badly altered, the bulk composition remains stable, and
XRF reports that stable interior.
SEM/EDS, by contrast, reads only the top few microns-and
on an unpolished war nickel, that surface is chemically chaotic. Mn
segregates out of the Cu/Ag matrix, oxides, the brittle Mn-oxide sheets which react
with S and Cl and also the trapped environmental particles (Si, Al, Fe). SEM/EDS
is therefore measuring a thin, unstable, contaminated, corrosion-rich skin
rather than the true alloy. That's why SEM/EDS looks "all over the place": it
is faithfully reporting the surface chemistry, which is wildly different
from the bulk alloy that the XRF instrument measures going deeper into the
alloy.
2.
Explain the Mn surface and bulk behavior differences with XRF and
SEM/EDS?
Answer: Manganese behaves very differently in the bulk
alloy than it does at the surface, and that difference is exactly
why XRF and SEM/EDS diverge so sharply on WWII nickels. In the bulk Cu-Ag-Mn
matrix, Mn is fully dissolved during the original melt and remains evenly
distributed throughout the interior of the coin. XRF penetrates deeply enough
to "see" this stable interior, so it reports values close to the Red
Book alloy. But at the surface, Mn follows a completely different chemical
pathway: it segregates out of the matrix, migrates upward over decades,
and oxidizes aggressively. Once Mn reaches the surface, it forms brittle Mn-oxide
sheets, reacts with sulfur and chlorine, traps environmental debris, fractures,
and eventually delaminates. SEM/EDS only measures this thin, unstable,
corrosion-rich skin-so it captures the Mn-rich oxides, the depleted Cu/Ag
beneath them, and all the contaminants embedded in the cracked surface.
3.
Explain the delamination effects of SEM/EDS analysis?
Answer: Delamination has a very strong and very
predictable effect on SEM/EDS because EDS only measures the top few microns
of the surface. When a WWII Cu-Ag-Mn nickel delaminates, the surface is no
longer a single, continuous metallic layer-it becomes a stack of fractured
Mn-oxide sheets, lifted flakes, voids, exposed Ag-rich subsurface metal,
and pockets of trapped environmental debris. EDS cannot average through these
layers the way XRF can; instead, it samples whatever fragment happens to be
directly under the beam. Hence the diverse data reported.
Some questions to
consider when comparing XRF data and SEM/EDS data:
Answer #3: Continued: If the beam lands on a lifted
Mn-oxide sheet, you get a Mn-rich spectrum. If it lands on a crack exposing Ag-rich
interior metal, you get elevated Ag. If it lands on a debris-filled void, you
detect Si, Al, Fe, Cl, or S. This makes the data appear "chaotic," but it is a
faithful map of a chemically stratified, mechanically broken surface.
Delamination turns the top of the coin into a patchwork of chemically different
micro-zones, and EDS-being a upper surface-only technique-reports each of those
zones exactly as it finds them.
4.
How do we know a target point is enriched with Mn using SEM/EDS we could
simply target a point enriched in Mn as we did with Cu & Ag. We can agree
that Mn oxides along with S & Cl aid to delaminate the surface but what of
truly enriched Mn area?
Answer: We've already demonstrated in the data that Mn
behaves differently depending on whether you're sampling intact alloy or the
fractured, oxide-rich surface. The simplified picture is this: true Mn
enrichment only shows up when the EDS beam hits a zone where Mn has
migrated out of the Cu/Ag matrix but is still present as a metallic or mixed
metallic/oxide phase. These points show Mn alongside Cu and Ag, not just Mn
and oxygen. That coexistence is the signature of Mn still bonded within the
alloy rather than sitting on top as a detached corrosion sheet.
Many Mn-heavy readings on a WWII nickel come from Mn-oxide
flakes, which form after decades of segregation and surface migration.
These flakes contain very little Cu or Ag, so they produce spectra dominated by
Mn and O, sometimes mixed with S or Cl. Those readings tell you about surface
chemistry, not alloy chemistry. The challenge is that the surface is a
patchwork of lifted oxides, voids, cracks, and debris, so many random points
will hit corrosion rather than metal. That's why Mn appears "all over the place"
unless you deliberately target transition zones.
The way we confirm true Mn enrichment is by selecting
points where the surface has cracked open and exposes the Mn-bearing
transition layer between the oxide sheet and the underlying Cu/Ag matrix.
In these zones, Mn is elevated above Red Book proportions but still accompanied
by metallic Cu and Ag peaks. Those spectra show Mn that has genuinely migrated
and enriched the alloy surface-not just Mn sitting in a brittle oxide layer.
This is exactly what some data has captured: both Mn-oxide delamination and real
Mn enrichment (i.e., levels above Red Book values of 9%) in the underlying
metal, depending on where the beam was placed.
5.
Is it mostly Mn oxides with S & CL causing the delamination or Mn
surface enrichment. Can we say for certain. Is more data needed?
Answer: This remains an open question rather than a settled
conclusion, because the data from Coin #3-and
from the other two war nickels scanned-shows both mechanisms operating,
and the current data set isn't large enough to quantify which one dominates.
Answer#5 Continued:
What we can say confidently is that Mn-oxide
formation with S and Cl contamination is capable of driving delamination on its
own: Mn migrates, oxidizes, forms brittle sheets, reacts with S/Cl, and those
mixed corrosion films fracture and lift. That pathway is clearly present in the
SEM microstructure and EDS spectra (i.e., Map Sum Summaries).
But we also see evidence of true Mn surface enrichment-points
where Mn is elevated alongside Cu and Ag, not just Mn and oxygen. Those
transition-zone spectra show Mn that has migrated out of the matrix and
enriched the upper metal layer before oxidizing. That means the surface isn't
just covered with Mn-oxide flakes; some regions of the underlying alloy itself
have been chemically modified by Mn migration. Whether that enriched metal
layer contributes significantly to delamination is still uncertain, because the
dataset is small and the surface is highly heterogeneous.
So, the honest conclusion is this: both Mn-oxide/S-Cl
corrosion and Mn surface enrichment are present, and both plausibly
contribute to delamination, but the current data cannot determine which
mechanism is primary. We would need more controlled sampling-multiple points
across intact metal, oxide sheets, transition zones, and delaminated edges-to
resolve the relative contribution degree of these processes.
Final Questions and Thoughts/Answers for this Paper (Some
repeated due to importance):
Q: Why does XRF fail to detect manganese surface
enrichment while SEM/EDS confirms it? A: XRF averages deeply into the
bulk alloy and cannot resolve thin, discontinuous Mn-rich layers near the
surface. SEM/EDS samples only the top few microns, revealing localized Mn
migration and enrichment that XRF cannot see. Together, they show that the bulk
alloy remains below 9% Mn while the surface contains real but limited Mn-enriched
zones.
Q: Does manganese surface enrichment contribute to
lamination? A: Yes. SEM/EDS demonstrates that Mn migrates toward the
surface and enriches the upper metal layer before oxidizing. These enriched
transition zones are structurally weak and participate in delamination. The
current dataset cannot determine whether this mechanism is primary or
secondary, but it is clearly present and metallurgically significant.
Q: What roles do manganese oxides, sulfides, and
chlorides play in the lamination process? A: The oxide compounds
originate during alloy solidification and form brittle inclusions that never
fully integrate into the Cu-Ag matrix. Rolling elongates them into internal
stringers that act as weak planes. Once exposed at the surface, they react with
moisture, salts (chlorides), and pollutants (sulfur), accelerating peeling and
flaking. Their presence is confirmed by SEM/EDS and they remain a major driver
of lamination.
Q: Why is lamination so common in wartime Jefferson
nickels? A: The Cu-Ag-Mn alloy was metallurgically incompatible from the
start. Internal Mn-oxide stringers formed during strip preparation, and later
Mn migration created unstable surface layers. Environmental reactions further
weakened these regions. The combination of internal and surface instability
makes lamination nearly universal in the 1942-45 series.
Q: What additional work is needed to determine the
primary lamination mechanism? A: More SEM/EDS mapping of transition
zones, deeper sampling of intact metal versus oxide layers, and broader point-targeting
across multiple coins. The current dataset confirms both internal Mn-oxide
stringers and true Mn surface enrichment, but more data is required to
determine which mechanism dominates and therefore which is primary and
secondary.
Conclusion: The XRF results show that bulk manganese
levels in these wartime Jefferson nickels remain below the U.S. Coinage Red
Book's 9% Mn reference value, confirming that the interior alloy retains its
original Cu-Ag-Mn proportions. However, SEM/EDS reveals a more complex surface
story: while XRF does not detect surface-level Mn enrichment, EDS clearly
identified some localized zones where Mn has migrated and enriched the upper
metal layer before oxidizing. This demonstrates that true Mn surface
enrichment does occur, even though it is too thin and discontinuous for XRF
to register. Thus, both datasets together show that lamination cannot be
explained solely by a bulk alloy composition.
The evidence indicates that two manganese-driven
mechanisms contribute to lamination. First, Mn-oxide, Mn-chloride, and Mn-sulfide
compounds form during alloy solidification, where manganese's strong affinity
for oxygen and reactive species produces brittle inclusions that fail to
dissolve into the Cu-Ag matrix. These inclusions elongate into stringers during
rolling, creating weak internal planes that later express as surface
separations. Second, SEM/EDS confirms that Mn also migrates toward the surface
over time, enriching the upper metal layer and forming mixed metallic/oxide
transition zones. These enriched regions are structurally unstable and can
contribute to delamination when they oxidize, crack, or interact with S and Cl.
The absence of measurable Mn enrichment in XRF data shows
that these enriched layers are thin and localized, but their presence in
SEM/EDS spectra demonstrates that they are real and potentially significant.
Lamination therefore reflects a structural failure originating inside the
alloy, compounded by surface-level Mn migration and oxidation. What
appears at the surface is the combined expression of internal Mn-oxide
stringers and later Mn-enriched zones that weaken the metal from above.
Environmental exposure further accelerates this process. Mn-sulfide
and Mn-chloride phases are chemically unstable and react readily with moisture,
salts, and atmospheric pollutants. These reactions weaken both the internal
oxide-based seams and the enriched surface layers, promoting lifting, peeling,
and flaking. SEM/EDS mapping of darker Mn-bearing areas confirms the presence
of these reactive phases and shows that Mn levels in these zones remain below
9%, consistent with XRF but still elevated relative to surrounding Cu/Ag.
Taken together, the data supports a clear, updated
conclusion: lamination in wartime Jefferson nickels is driven by both
internal Mn-oxide stringers and true Mn surface enrichment, with
environmental Mn-sulfide and Mn-chloride reactions further destabilizing the
already fragile structure. At present, the dataset does not allow us to
determine which mechanism is primary; both are present, both are
metallurgically credible, and both contribute to the lamination peel phenomenon
seen across the WWII nickel series. Additional SEM/EDS work will refine the
mapping of enriched zones and help determine the relative weight of each
mechanism.
Glossary of Terms
Note: Some of these definitions when appropriate were
obtained from the Counterfeit Eight Reales (The Un-real Reales) book produced
by Robert Gurney, Gord Nichols and this author in 2013 and being sold through
Amazon Books. Some other definitions were obtained from my book Forgotten Coins
of the North American Colonies - 25th Anniversary Edition also being
sold on Amazon Books. The remaining definitions were obtained from the Internet
or from Material Analysis papers in my library of other similar Material Analysis
numismatic investigations.
Delamination - Delamination is the separation of
metal along a weak internal plane, typically created by elongated inclusions,
oxide films, or poorly bonded layers introduced during casting, rolling, or
cladding. Under mechanical stress, these pre-existing planes lose cohesion and
split, producing sheet-like peels or fissures aligned with the working
direction. The exposed surfaces often show smooth, planar metallic undersides
if the failure is mechanical, or rough, oxidized textures if corrosion assisted
the separation. Delamination reduces structural integrity, concentrates stress,
and can propagate under continued deformation or environmental attack.
Die Crack - A die crack is a fracture in the minting
die that transfers onto every coin struck thereafter. As the hardened steel dies
work, fatigue or excessive stress create hairline fractures. When a fissured
die strikes a planchet, displaced metal flows into the crack, leaving raised,
branching lines on the coin surface. These raised lines follow consistent
patterns across multiple specimens and radiate from high-stress areas on the
die, such as the fields or rims. The specimens in this study were not prone to
die cracks as the working die did not crack produce a "raised line" on the
surface of the coin but are planchet fissures (cracks) in the actual coins. See
the definition of planchet fissure.
Embrittlement - Embrittlement is the loss of a
material's ability to deform plastically, turning what was once ductile and
tough into something brittle and prone to sudden fracture. It happens when
changes at the atomic or microstructural level-such as impurity segregation,
precipitate formation, or phase transformations-make it much harder for the
material to absorb energy before breaking.
Common forms include temper embrittlement, were certain
alloying elements cluster at grain boundaries during heat treatment. These
mechanisms raise the risk of crack initiation and rapid crack propagation under
stress. Preventing embrittlement involves controlling composition, processing,
and service conditions. Strategies include using cleaner raw materials,
optimizing heat-treating schedules to avoid harmful precipitates. Practices
obviously all absent at the Tegucigalpa Mint in Honduras.
False Positive - A false positive is when a
scientist determines something is true when it is false (also called a
type I error). A false positive is a "false alarm." A false negative is saying
something is false when it is true (also called a type II error).
Grain Boundary - A grain boundary is the line or
curve you see on a micrograph that marks where two tiny crystals (called
grains) meet within a metal or ceramic. As the material cools or solidifies, it
forms many of these small crystals with different orientations, and the
boundary is simply the border where one orientation ends, and another begins.
After etching the surface, these borders become darker or more pronounced,
making the grain structure visible under a microscope.
These boundaries play a key role in a material's behavior.
They can block the movement of dislocations (defects that carry plastic
deformation), which usually makes the material stronger and harder. At the same
time, grain boundaries can act as highways for atoms or impurities to diffuse,
and they can become sites where cracks start, or corrosion accelerates.
Inclusion - An inclusion is any non-metallic particle
or foreign phase trapped within a metal during melting, refining, or
solidification. These particles can be oxides, sulfides, silicates, or
entrapped slag fragments that fail to dissolve into the surrounding matrix.
Because inclusions differ in composition and mechanical behavior from the host
alloy, they often act as stress concentrators or weak planes during
deformation. Their size, shape, and distribution strongly influence properties
such as toughness, ductility, and surface integrity. In wrought or struck
metals, elongated inclusions can form seams or streaks that guide crack
initiation and lamination.
Lamination Error - A lamination error is a surface
defect where layers of the planchet metal fail to bond completely. Entrapped
oxides, slag films, or inclusions formed during casting elongate into streaks
during rolling but remain unbroken if annealing is insufficient. When the coin
is struck, these planar defects separate, producing flaky, peeling streaks that
reveal brighter fresh metal beneath. Lamination errors are irregular, follow
metal-flow lines, and produce raised, jagged edges rather than smooth depressions
as seen in a struck-thru error.
Map Sum Summary - This map displays the element
concentrations of the target elements, sometimes called a "quantitative
map". In other words, the metal assay at a particular target point of a
coin's surface.
Microstructure - Microstructure is the very
small-scale structure of a material, defined as the structure of a prepared
surface of material as revealed by an optical microscope (i.e., SEM Microscopy)
minimally above a 25× magnification generating brittle lead salts and oxides
(PbSO₄, PbCl₂, PbO) that create chalky layers and obscure mint details.
Oxygen Enrichment - Oxygen enrichment refers to an
abnormally elevated concentration of oxygen within a metal or at a specific
microstructural site, typically detected by SEM/EDS or other analytical
methods. It usually indicates the presence or formation of oxide phases-such as
Mn-oxides, Fe-oxides, or mixed metal oxides-that have developed during melting,
solidification, service exposure, or corrosion. Localized oxygen spikes often
mark chemically active defects, including oxide inclusions, blistering, or sub-surface
oxidation fronts. Because these oxygen-rich regions differ sharply from the
surrounding metallic matrix, they can weaken bonding, promote crack initiation,
and drive progressive failure under stress or environmental attack.
Planchet Fissure - A planchet fissure is a crack that
opens in the metal blank itself, caused by internal stresses or pre-existing
weak zones. These fissures originate from improper rolling schedules,
inadequate or uneven annealing, and lamination planes formed by oxide films or
inclusions. Under the pressure of striking-or later mechanical or environmental
stress-these flaws split through the thickness of the planchet, producing
irregular, open cracks that may extend from the rim into the field or design. The
high Pb was not the cause confirmed in this study.
Point & ID Analyses - Utilizing a SEM Micrograph
certain different shaded regions of black and white were selected for metal
assay determination called spectrum areas. In this paper generally the level of
1000X magnification was chosen and different spectrum areas were circled (i.e.,
identified by the MSU analyst as target areas of analysis) and their metal
assays in these regions were reported for each spectrum area (i.e., target
area). The spectrum regions selected in a standard Point & ID Analysis
normally number in the three to five range. In this study due to the simplicity
of this Cu/Pb binary alloy, three spectrum areas were considered sufficient.
Rolling Mill Lamination - Rolling-mill lamination is
a mechanical defect formed when layers within a metal strip fail to bond
properly during rolling, leaving a pre-existing plane of weakness parallel to
the working direction. These unbonded or poorly bonded layers originate from
trapped scale, oxide films, slag streaks, or cold-shut surfaces that were never
fully welded together under mill pressure. When the strip is later stressed, especially
during striking, this latent seam opens into a long, planar split with clean
metallic surfaces and directional geometry. Because the flaw is created during
rolling rather than by chemical reaction, the lamination is stable, chemically
quiet, and shows no oxygen enrichment or evolving oxide behavior. These re the
types of laminations seen outside of the war time nickel era for these
Jefferson Nickels. They're the "normal," mechanically generated laminations
that occur in Cu-Ni strip when something prevents full bonding during rolling.
Nothing about them is chemically reactive, nothing grows over time, and you
don't get the Mn-oxide or Mn-sulfide behavior that makes the WWII alloy such an
outlier.
SEM/EDX (EDS) - Scanning Electron Microscopy (SEM)
with energy dispersive X-Ray spectrometry (SEM/EDS). Generally classified as an
excellent analysis method for cultural heritage type material like coins. The
chemical characterization of a coin facilitates the determination of the
general provenance and age (i.e., CCC or Modern 20th / 21st
century forgery). It also allows its production technology (i.e., cast or
struck), intended purpose and the overall authenticity (i.e., regal vs.
non-regal). In this study with Michigan State University - Material Analysis
Department a triple tier analysis method was developed & utilized: Map Sum
Spectrum/SEM Micrograph/Point & ID Spectrum Analyses.
Spectrum - In this study the spectrums were metal
assays at a particular target area on a coin's surface. SEM Micrograph spectrum
areas were selected for the different shades they exhibit in these Black &
White photomicrographs. The different shaded regions indicate different metal
or metal alloy regions within the SEM Micrograph. Any area selected by the
Point & ID method can be characterized with its metal alloy make-up or the
predominant metal in this area. The Map Sum Spectrum is also utilized and is the
metal assay at a particular target area of the coin. Both are powerful tools in
this three-tier SEM/EDS analysis method in metal alloy assay determinations.
Stringer - A stringer, in the context of MnO in
Jefferson war nickels, is an elongated manganese-oxide inclusion that becomes
stretched into a thin, ribbon-like seam during rolling of the planchet strip.
MnO and related Mn-rich oxides form early in the melt because manganese has a
strong affinity for oxygen. These oxides are hard, brittle, and non-metallic,
so when the Cu-Ag-Mn alloy is rolled to final thickness, the surrounding metal
flows plastically while the oxide particles do not. The result is that originally
globular MnO inclusions are drawn out into long, continuous streaks aligned
with the direction of metal flow.
These MnO stringers act as built-in weakness planes inside
the alloy. Because they do not bond well with the copper-silver matrix, they
interrupt grain boundaries and create thin zones where the metal is poorly
integrated. Under striking pressure, these seams are pushed closer to the
surface, where they can terminate as microcracks, dark streaks, or the small
black globules you've been documenting. Once exposed, they become prime sites
for lamination, peeling, or environmental attack.
In short, a stringer is the mechanically elongated form of a
manganese-oxide inclusion-an internal seam created by Mn-oxides brittleness and
incompatibility with the surrounding alloy. It is one of the defining
structural defects responsible for the characteristic lamination behavior of
wartime Jefferson nickels.
Struck Through Error - A struck-through error occurs
when foreign debris-fabric, grease, wire, or other contaminants-becomes trapped
between the die and the planchet at the moment of striking. The resulting
imprint is a smooth depression or void conforming to the shape of that debris,
usually surrounded by normal raised fields. Unlike lamination or fissures,
struck-through voids are clean and well-defined, without lifted or jagged metal
edges.
Surface Contaminants - A group of metals found on a
coin's unpolished surface originating from environmental air or soil exposure.
Two common surface contaminants are sulfur (S) and chlorine (Cl). From previous
studies by this author these two contaminants can be considered almost universally
seen on all coin surfaces - it's just a question of what the wt.% will be that
is recorded by the Material Analysis instrument such as an XRF operating with an
accompanying vacuum chamber or SEM/EDS instrument hich always operates in a
vacuum chamber.
Target Area (XRF or SEM/EDS) - In this study a random
area of the coin's surface was selected for Map Sum Spectra analysis. In the
spectrum areas within the Point & ID analysis particular areas of the SEM
Micrograph is selected as a "target area "based on their different shades of
Black & White intensity. So, a target area is a point of analysis which can
be random (i.e., Map Sum Spectra) or non-random (i.e., Point & ID analysis
spectrum area).
Triple Tier Analytical Method - With each target
point at a coin's surface utilizing SEM/EDS analysis a Map Sum Spectra/SEM
Micrograph/Point & ID Spectrum Areas are generated. Then with the Map Sum
Spectra and Point & ID the metal assay results of the coin's alloy and the
SEM Micrographs yield information if the coin is cast or die struck based on
the coin's microstructure.
Twin (Grain) Line Microstructure - A microstructure
seen in struck coins. Either a jigsaw like pattern or slip lines in the form of
fine parallel or intersecting lines with slightly curved twin bands. Quite
different than the dendritic nebulae type microstructure of a cast coin.
Sometimes it is also called a twin (grain) microstructure. Both terms are
similar.
X-Ray Fluorescent Testing (XRF) - A non-destructive
form of forensic scientific analysis (as is SEM/EDS) of the metallic elements
contained in an object using "secondary" fluorescent emissions produced by
bombardment with gamma or x-rays. Normally several target areas are recommended
for unpolished surface coin areas.
References
- Wikipedia definition of the overall benefits of SEM/EDS analysis.
- This
is supported by the ASTM E3 Standard Guide for Preparation of Metallographic
Specimens, which outlines typical grinding/polishing stages and their expected
removal depths.
- Surface
corrosion layers on copper-alloy and silver coins vary widely depending on
burial environment, alloy composition, and moisture-ion exposure, but archeometallurgical
studies consistently document that these layers can reach tens to several hundred
microns
in thickness. Stratified patinas composed of cuprite, malachite, tenorite, and
chloride-rich alteration zones often build outward over long burial periods,
producing cumulative corrosion shells that may exceed 200-300µm in archaeological
contexts. This range is well established in conservation literature,
particularly in the work of Scott (Copper and Bronze in Art, Getty Conservation
Institute) and Robbiola et al.,
who describe multi-layered patinas with total thicknesses extending into the
hundreds of microns. By contrast, modern or shallow-buried coins typically show
much thinner alteration layers. Recent quantitative work on Qing-era copper
coins, for example, reports corrosion thicknesses around 9µm, reflecting limited
burial time and relatively stable environmental conditions. These measurements
illustrate that corrosion thickness is not uniform across numismatic materials
but instead reflects the specific chemical and physical history of each specimen.
Electrochemical studies of modern alloys likewise focus on corrosion mechanisms
rather than patina depth and rarely report layers thicker than a few microns.
The ~250µm figure therefore
represents the upper end of what is observed in long-buried copper-alloy
artifacts rather than a universal expectation. It aligns with published
descriptions of thick, stratified patinas in archaeological bronzes and silver
coins, where cuprite cores, chloride-rich intermediate layers, and outer
carbonate or oxide crusts accumulate over centuries. In these cases, the corrosion
layer becomes a substantial microstructural feature, often exceeding the depth
of surface-level polishing or mechanical cleaning methods. When referencing a
250µm corrosion layer in a
study, it is most accurate to frame it as consistent with the documented upper range of archaeological
patina development rather than as a standard value. Citing Scott (Getty
Conservation Institute), Robiola's corrosion-stratigraphy research, and broader
archeometallurgical surveys provides a solid scholarly foundation for this
magnitude of surface alteration.
Acknowledgments
The author has been greatly assisted by detailed discussions
with Abby Vanderberg of Michigan State University Material Analysis Laboratory.
This triple tier analysis method of Map Sum Spectra/SEM Microstructure Micrograph
at 400X & Point ID Spectrum Analysis at a preferred 1000X magnification level
where all on their expertise as well as suggesting preferred spectrum areas in
the Point & ID Analysis section.
The author has also been assisted by Winston Zack in
performing the preliminary XRF Analysis for this paper. Winston Zack wrote the
numismatic Bad Metal books, and they are a landmark contribution to the study
of U.S. Federal circulating contemporary counterfeits within U.S. coin
collecting. Winston Zack is certainly another top tier numismatist who
understands the importance of Material Analysis in numismatics, whether
utilized in collecting contemporary circulating counterfeit or analyzing U.S. regal
(i.e., legitimate U.S. Mint issued) coins to explain errors as in World War II
Jefferson War Nickels or other abnormal behavior that sometimes happens to
numismatic items along the pedigree chain.